


Abstract
An autoimmune-mediated process in the pathophysiology of narcolepsy type 1 (NT1) is highly suspicious, if this pathomechanism is transferable to other types of central disorders of hypersomnolence (CDH), is still controversial. The association of NT1 with HLA class II system implicates a T-cell-mediated autoimmunity, in which helper CD4+ T-cells and cytotoxic CD8+ T-cells may be pathogenic. This study aimed to identify specific immune profiles in peripheral blood (PB) and cerebrospinal fluid (CSF) in different types of CDH. Forty-three people with polysomnographically confirmed CDH (24 idiopathic hypersomnia [IH], 12 NT1, and 7 NT2) were compared with 24 healthy controls (HC). PB and CSF were analyzed with multiparameter flow cytometry to distinguish between subclasses of peripheral and intrathecal immune cells and specific surface markers of T-cells. The overall proportion of helper CD4+ T-cells and cytotoxic CD8+ T-cells in PB and CSF did not differ between the patients and HC. Activated HLA-DR+ CD4+ T-cells and HLA-DR+ CD8+ T-cells in PB and CSF both in NT1, NT2 and IH were significantly increased compared with HC. A significant correlation of HLA-DR+ CD4+- and HLA-DR+ CD8+ T-cells with higher amounts of excessive daytime sleepiness was found in the NT1 and IH groups, indicating an association of activated T-cells in the central nervous system with an increase in sleepiness. These findings provide further evidence of a T-cell-mediated autoimmunity not only in NT1, but also in NT2 and IH. Moreover, the identification of activated cytotoxic CD8+ T-cells further supports the evidence of T-cell-mediated neuronal damage, which has previously been suggested in NT1.
Although an autoimmunological pathogenesis of narcolepsy is almost confirmed, this is the first time that a specific T-cell activation in both peripheral blood (PB) and cerebrospinal fluid (CSF) was detected in people with different types of central disorder of hypersomnolence, including narcolepsy type 1 (NT1), 2 (NT2), and idiopathic hypersomnia (IH). Activated HLA-DR+ CD4+ and HLA-DR CD8+ T-cells in the PB and CSF were increased in people with hypersomnolence compared with healthy controls. This finding may elucidate the pathogenetic association between the different types of hypersomnolence and may offer new ways of diagnosis and therapy.
Introduction
According to the recent classification of sleep disorders, central disorders of hypersomnolence (CDH) is subdivided into three main entities not associated with psychiatric, neurological or other disorders, and medication or substance intake. These include narcolepsy with cataplexy (NT1), narcolepsy without cataplexy (NT2), and idiopathic hypersomnia (IH) [1]. The prominent symptom in people with CDH is excessive daytime sleepiness (EDS) with irresistible sleep attacks during the day and difficulties in sustaining attention. Although hypersomnolence syndromes occur in all the main subtypes, until now no common pathophysiological denominator is evident.
Epidemiological data on different types of CDH are scarce. NT1 is the most common one with a prevalence varying between 0.025% and 0.05% [2]. Within the last two decades, numerous neurophysiological and neuroimaging studies advanced our understanding of the etiology, pathophysiology, and clinical manifestations of NT1. These studies have shown that the clinical symptoms of narcolepsy may be caused by a dysfunction of multiple networks in the brainstem, diencephalon, and frontal and limbic cortical regions [3, 4]. This dysfunction is mainly caused by a loss of hypocretinergic neurons in the lateral hypothalamus and can be demonstrated with low hypocretin-1 levels in the cerebrospinal fluid (CSF).
A strong association in NT1 with more than 95% of cases carrying the HLA class II allele DQB1*06:02 points towards the involvement of predisposing genetic and immune factors [5]. HLA-DQB1*06:02 encodes for molecules constitutively expressed on antigen-presenting cells such as macrophages, B-cells, and dendritic cells which present antigenic peptides to CD4+ T-cells. It is unlikely that CD4+ T-cells directly cause destruction of neurons because CD4+ T-cells are not cytotoxic and HLA class II molecules are not expressed on neurons [6]. In contrast, HLA class I molecules are expressed by nearly all nucleated cells including neurons. Therefore, HLA class I molecules interacting with cytotoxic CD8+ T-cells are likely to be involved in autoimmune reaction leading to neuronal cell death [7, 8]. Indeed, a recent study revealed a narcolepsy-associated HLA class I allele which might be implicated in T-cell-mediated cytotoxicity [9, 10].
Furthermore, the hypothesis of an autoimmune origin is supported by the identification of possible immunological triggers prior to the manifestation of narcolepsy as has been seen with the H1N1 virus infection, H1N1 vaccination, or upper-airway infections with streptococcus pyogenes with a consecutive immunological priming [11]. Additionally, genome-wide association studies found an association with the T-cell receptor alpha-chain gene (TCRA) which encodes the alpha chain of the TCR alpha/beta heterodimer [12]. This T-cell receptor protein interacts with both HLA class 1 on cytotoxic CD8+ T-cells and HLA class II on helper CD4+ T-cells. Until now very little has been known about the role of CD4+ und CD8+ T-cells in the pathogenesis of narcolepsy [13]. A recent study reports an increased level of activated CD4+ T-cells in people with NT1 compared with HC focusing on T-cells in the peripheral blood (PB) [14].
In case of NT2 without cataplexy, the underlying pathogenesis seems to be more heterogeneous. With a positive HLA-DQB1*06:02 in only 41% and a hypocretin-1 deficiency (Hcrt-1) with intermediate values of Hcrt-1 between 110 and 200 pg/mL in 25%, the etiology and pathophysiology in NT2 remains largely unknown [15, 16]. If NT2 can be regarded as an early stage or an incomplete variant of NT1 is still unclear [17]. Lower frequencies in the HLA class II alleles in NT2 give hints for altered pathogenic mechanisms in NT2 compared with NT1.
IH is a rare disease and due to a lack of epidemiological studies, the prevalence of IH remains largely unclear. Based on a small cohort, it is estimated that IH occurs 40%–60% as frequently as narcolepsy [18] with a prevalence of approximately 0.005% [19].
The diagnosis of IH is based on clinical observation and electrophysiological measurements. IH comprises a combination of symptoms, characterized by EDS and a persistent decreased amount of alertness during daytime, despite uninterrupted sleep pattern during the night.
In approximately only 18%–24% of all people with IH, HLA-DQB1*06:02 can be found [18]. With 12% to 38% of the general population to be tested positive for HLA-DQB1*06:02, it is unlikely that this allele plays a pathological role in IH. No further genetic predispositions have been identified so far to characterize the complex disorder of IH. Unlike in narcolepsy, animal models of IH do not exist and the pathophysiology remains largely unknown and speculative.
The role of immunological and inflammatory aspects in the pathogenesis of IH is largely unknown. There are hints of an altered distribution of IgG subclasses in people with IH in comparison to HC and NT1, indicating a role of humoral immune factors in IH [20].
Following the hypothesis of an autoimmune origin in NT1, the initial aim of our study was to investigate the immune cell profile in both peripheral blood and CSF of people with CDH. Sharing the same core symptom of EDS, we hypothesized an immune-mediated mechanism playing a potential role in the subtypes NT2 and IH.
Methods
Participants
Fourty-three patients suffering from CDH were recruited from the Department of Neurology, Division of Sleep Medicine and Neuromuscular Disorders at the University Hospital, Muenster. According to diagnosis, they were divided into three groups: IH, NT1 and NT2, and compared with HC. Diagnosis was confirmed polysomographically and included multiple sleep latency testing (MSLT) after the first PSG night with at least 6 hr sleep. Procedures were performed according to the standard criteria (American Academy of Sleep Medicine [AASM]) [21]. Exclusion criteria included the presence of neurodegenerative diseases, primary neuroinflammatory diseases, psychiatric-, and other medical disorders. People with sleep-disordered breathing and/or obesity (BMI > 35) were also excluded. Twenty-four patients fulfilled diagnostic criteria of ICSD-3 for IH (14 females; mean age 39.2), 12 patients for NT1 (5 females; mean age 31.9), and 7 patients for NT2 (4 females; mean age 34.4).
The Epworth Sleepiness scale (ESS) was administrated to all patients to assess self-reported sleepiness the day before the PSG. CSF and PB were collected after PSG and MSLT. Standard CSF analyses included (1) cell count (cells/mcL) protein-, glucose, lactate, total protein-, albumin-, IgG-, IgM-, and IgA- measurements, (2) oligoclonal bands, (3) hypocretin-1 measurement, and (4) multiparameter flow cytometry. Peripheral blood analyses included (1) standardized blood count, (2) measurement of thyroid stimulating hormone, (3) HLA typing of DQB1*06:02, and (4) multiparameter flow cytometry. The study was conducted according to the declaration of Helsinki.
Healthy controls
Twenty-four age-matched controls were recruited at the Department of Neurology at the University Hospital, Muenster. CSF obtained from these controls was originally secondary to a suspected presence of a primary neurological disorder, but retrospectively these participants were found to suffer from a somatoform disorder. None reported EDS. All participants in the control group fulfilled the following laboratory criteria of a noninflammatroy CSF: <5 cells/µL, <500 mg protein/mL, <2 mM lactate, no disruption of the blood–brain barrier (BBB) defined by the albumin CSF/serum quotient, and, according to Reiber criteria, no intrathecal immunoglobulin IgG, IgA, or IgM synthesis and no oligoclonal bands.
HLA typing
HLA typing was performed using the Kit Allele SEQR-HLA-DQB1 following the manufacture’s instruction.
CSF analyses, measurement of hypocretin-1, and multiparameter flow cytometry
CSF samples were collected in polypropylene tubes. Routine analyses and multiparameter flow cytometry were processed within 20 min after collection. Blood-stained CSF was excluded from the study. Blood and CSF samples were drawn at the same time during the late morning or early afternoon after a light breakfast.
For CSF-hypocretin-1 measurement, an extra tube of 2 mL CSF was cooled on ice and stored within 60 min at −80°C until analysis. Hypocretin-1 in CSF was analyzed by radioimmuno-assay from Phoenix Pharmaceuticals (Belmont, CA) according to the manufacturer’s instructions. All measurements were done in duplicates and the means of the results were calculated. The HCRT-1 concentration was subdivided into the following groups: low (<110 pg/mL), intermediate (>110–200 pg/mL), and normal (>200 pg/mL). According to recent studies, CSF-hypocretin-1 concentration of approximately 200 pg/mL served as cutoff for the diagnosis of narcolepsy with cataplexy with a high specificity of 99% and a low sensitivity of 33% [16].
Using multiparameter flow cytometry, we analyzed the potential disease–related changes in both peripheral and intrathecal immune profiles [22]. HLA-DR surface expression was used as a surrogate marker for T-cell activation and its upregulation suggests antigen presentation (Figure 1) [23].
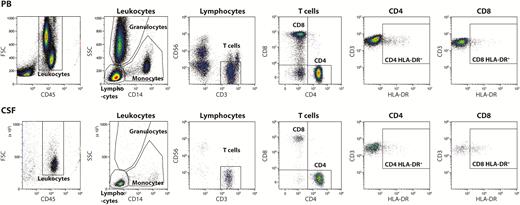
Gating strategy. Cells from the PB, top and CSF, bottom were stained with fluorochrome-conjugated monoclonal antibodies and analyzed by flow cytometry. Leukocytes were selected from a forward scatter channel (FSC) vs CD45 plot and further divided into lymphocytes, monocytes, and granulocytes based on side scatter channel (SSC) vs CD14 characteristics. T-cells were identified as CD3+CD56− lymphocytes and subsequently divided into CD4+CD8− and CD4−CD8+ T-cells. Finally, CD4 and CD8 T-cells were analyzed for HLA-DR expression.
The measurements and analyses were done by the Navios (Beckman Coulter).
After staining with fluorochrome-labeled antibodies, lymphocytes were displayed in a CD3−PC5.5 and CD19-APC Alexafluor plot and percentages of CD3−CD19+ B-cells were analyzed.
To distinguish between CD3−CD56+ NK-cells, CD3+CD56+ NKT-cells, and CD3+CD56− T-cells, lymphocytes were displayed in CD3-PC5.5 versus CD56-PC7 plots. T-cells were further split into CD4+ and CD8+ subsets (CD4-APC/CD8-PacificBlue plot). The percentages of HLA-DR positive CD4+ T-cells and HLA-DR positive CD8+ T-cells were analyzed including CD45+CD3+CD56−CD4+CD8− and CD45+CD3+CD56−CD4−CD8+ lymphocytes, respectively.
Statistics
All statistical analyses were performed using SPSS (version 23.0.0; SPSS, Chicago, IL).
Clinical, biological, and polysomnographic data are given as means ± standard deviation; data of peripheral blood, CSF, and multiparameter flow cytrometry are presented in median and interquartile range (IQR).
To test for statistical significance, nonparametric procedures (Kruskal–Wallis test) were applied. Level of significance was set at p < 0.05. Kruskal–Wallis test and Dunn’s multiple comparison as a post-test were applied to compare the distribution of lymphocytes in peripheral blood as well as in CSF among all four investigated groups.
Correlations between T-cell activation levels and clinical and polysomnographic data were calculated using the Pearson correlation. In all cases, p < 0.05 was considered to be statistically significant.
Results
Participants
Clinical and biological characteristics of all patient groups and HC are presented in Table 1. Age and BMI did not differ significantly in patients’ groups. The ESS of >10 points (from a maximum of 24 points) in all patients’ groups reflected a significant pathological sleepiness with the highest scores in the group of NT1. There are gender differences with less females in the NT1 group compared with IH and NT2.
Clinical and biological characteristics
| HC | NT1 | NT2 | IH | ||
|---|---|---|---|---|---|
| n = 24 | n = 12 | n = 7 | n = 24 | P | |
| Age (years) | 31.3 | 31.9 | 34.4 | 39.2 | 0.09 |
| Female sex (%) | 66 | 42 | 57 | 58 | 0.01* |
| BMI (kg/m2) (±SD) | N/A | 24.1 (3.3) | 24.9 (4.5) | 28.2 (5.6) | 0.08 |
| Caucasian (%) | 100 | 100 | 100 | 100 | |
| Initial ESS score, off treatment (±SD) | N/A | 17 (2.5) | 14 (3.1) | 15 (2.6) | 0.12 |
| HLA DQB1*0602 (%) | N/A | 100 | 43 | 8 | <0.0001†,‡, § |
| CSF-hypocretin levels [pg/ml) (±SD) | N/A | 65.7 (30.2) | 285.8 (88.2) | 337.3 (120.2) | <0.0001†,§ |
| CSF total protein [mg/L] (±SD) | 310 (91) | 458 (225) | 420 (220) | 370 (137) | 0.01*,|| |
Level of significance was set at P < 0.05.
HC = healthy controls; NT1 = narcolepsy with cataplexy (narcolepsy type 1); NT2 = narcolepsy without cataplexy (narcolepsy type 2); N/A = not applicable; data are presented as mean ± SD or number (percentage), except body mass index (BMI), which is presented as median (interquartile range).
*HC vs. NT1
†IH vs. NT1
‡IH vs. NT2
§NT1 vs. NT2.
||HC vs. NT2
PB and CSF parameters
Overall protein levels in CSF were slightly elevated in all patient groups with the highest amount in the IH group compared with HC (Table 1).
CSF-hypocretin-1 values were obtained in 42/43 patients, except in one patient suffering from IH. Significantly lower levels of hypocretin-1 (<110 pg/mL) were found, as expected, only in the group of NT1 in 10 of 11 patients with one participant showing intermediate hypocretin-1 level (118 pg/mL) above the threshold (Table 1).
Investigating the levels of total IgG, IgM, and IgA both in PB and in CSF revealed significantly increased levels of total IgG in CSF in NT1 and IH compared with HC with the highest levels of total IgG in the CSF in IH (Kruskal–Wallis test, p < 0.0001). Moreover, total IgM in CSF differed significantly between NT1 and IH compared with HC. There was no significant change in total IgA in both PB and CSF in all groups observed (Figure 2).
Serum and CSF levels of Ig in all study groups. Serum and CSF levels for total (A) IgG, (B) IgM, and (C) IgA levels in all study groups with CDH and HC. Levels are presented in median (*p ≤ 0.05; **p ≤ 0.01; ***p ≤ 0.001).
Polysomnography
Polysomnographic findings showed differences in the periodic leg movements during sleep (PLMS-) arousal index with a significantly higher PLMS index in both the NT1 and NT2 groups compared with IH. There was no significant difference in the percentage of REM sleep between the groups of people with CDH. As expected, number of SOREMs and mean sleep latency differ between the patient groups with significant lower latencies in NT1 and NT2 compared with IH (Table 2).
Polysomnographic characteristics of people with CDH, including narcolepsy with cataplexy (NT1), narcolepsy without cataplexy (NT2), and IH
| NT1 | NT2 | IH | ||
|---|---|---|---|---|
| n = 12 | n = 7 | n = 24 | P | |
| Total sleep time during night (min) | 397.0 (65.1) | 407.1 (57.3) | 404.3 (37.7) | 0.78 |
| Sleep stage 1 + 2 [%] (±SD) | 45.1 (9.5) | 47.1 (8.0) | 48.4 (7.3) | 0.61 |
| Sleep stage 3 [%] (±SD) | 21.1 (7.8) | 26.3 (9.7) | 21.6 (6.6) | 0.07 |
| REM sleep % (±SD) | 23.5(5.9) | 21.6 (3.6) | 20.1 (5.7) | 0.09 |
| PLMS arousal index/hr (±SD) | 4.2 (7.3) | 5.7 (7.7) | 0.4 (0.7) | <0.0001†,‡ |
| AHI, event/hr (±SD) | 0.6 (0.8) | 0.4 (0.7) | 1.7 (1.8) | < 0.001†,‡ |
| MSLT | ||||
| Mean sleep latency (MSL) [min] (±SD) | 4.3 (2.5) | 4.5 (1.6) | 5.6 (1.8) | 0.05†,‡ |
| SOREMs, [n] (±SD) | 3.0 (0.7) | 2.6 (0.5) | 0.2 (0.4) | < 0.0001†,‡ |
The percentage of REM sleep is slightly but not significantly elevated in NT1 and NT2 in comparison to IH, periodic leg movements (PLMS-) arousal index is significantly elevated in the group of NT1 (p = 0.003) and NT2 (p ≤ 0.001) compared with IH. In the group of IH, the apnea–hypopnea index (AHI) is slightly elevated in comparison to NT1 and NT2 (p ≤ 0.04) but still considered as normal. In the MSLT, patients suffering from NT1 had slightly more number of SOREMs than people with NT2. Only (5/24) of all patients with IH (21%) had one REM sleep episode during the MSLT.
Significant differences: †IH vs. NT1, ‡IH vs. NT2.
HLA typing
All patients were genotyped for HLA-DQB1*0602. All people with NT1 were positive for HLA-DQB1*0602, whereas only 43% of people with NT2 and only 8% of people with IH were tested positive.
PB and CSF flow cytometry analyses
Pleocytosis was not observed in the group of IH or NT 2 and in only one patient from the NT1 group (5 cells/µL). Although pleocytosis and oligoclonal bands in CSF were absent in all patients, an intrathecal disease-specific alteration in the immune profile might still occur as it is described in further neuroimmunological diseases [24]. Therefore, we analyzed the proportion of B-cells, antibody-secreting plasma cells, and T-lymphocytes in both PB and CSF of all participants.
There was no disease-related change in the proportion of B-lymphocytes in either PB or CSF. Furthermore, the proportions of the overall cytotoxic CD8+ T-cell and helper CD4+ T-cells in PB and in CSF did not differ between HC and any patient group. Concerning the CD4+ to CD8+ ratio, we observed no differences in the peripheral or intrathecal compartments among all groups.
Interestingly, antibody-secreting plasma cells (CD19lowCD138+) in the CSF were absent in HC and in all patient groups (Figure 3).
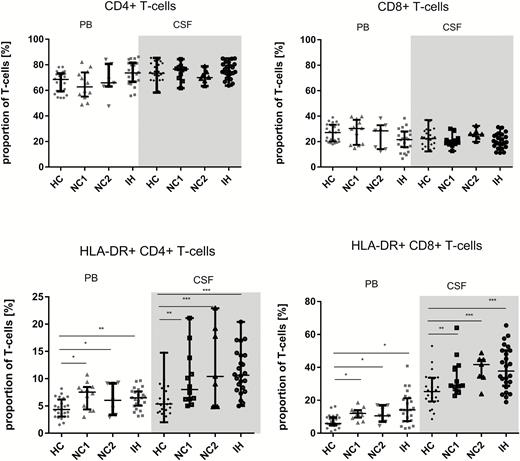
![Distribution of T-cells in the PB and CSF. (*p ≤ 0.05; **p ≤ 0.01; ***p ≤ 0.001). Distribution of T-cells in the PB and CSF. Proportion [%] of the CD4+ T-cells (CD3+CD56−CD4+CH8-), HLA-DR+ CD4+ T-cells, CD8+ T-cells (CD3+CD56−CD4−CH8+) and HLA-DR+ CD8+ T-cells of the overall T-cells were determined by multiflow cytometry in HC (n = 24), NT1 (n = 12), NT2 (n = 7), and IH (n = 24). Levels are presented as median with 25% and 75% quartiles. The nonparametric Kruskal–Wallis and Dunn multiple comparison as a post-test were performed to test for differences (*p ≤ 0.05; **p ≤ 0.01; ***p ≤ 0.001). Activated HLA-DR+ CD4+ T-cells and HLA-DR+ CD8+ T-cells were significantly higher in NT1, NT2, and IH both in PB and CSF compared with HC. HC = healthy controls; NT1 = narcolepsy type 1; NT2 = narcolepsy type 2.](https://oup.silverchair-cdn.com/oup/backfile/Content_public/Journal/sleep/42/2/10.1093_sleep_zsy223/1/m_zsy22303.jpeg?Expires=1716410765&Signature=cxGN2DkBwwCTKZrGT4VXVBU4U26pLxvGVM~eRdfIGFf4sguEcsiPhEkq78xfdx8dafZ7gRZxXCjif6onK0hw3Hv8PI578t3xhNgI5PCwwP0I~KFWJL2vGsSmb8YCbc2EHz4vHISqGpjGl44IMt93iLVjbOGt84QYYwIheFI8Y6dxhompCJ-CyVUjrcuLgY-4OxLa9gkL6MpZohUzdbnNPbhZ0~ojJX2ZiFMyGkTyNjDgKebfhHdqrY4cF63XYPQDiJLA1csQFuED1Q1-CrJ2tcbboydBnTeU5VANxSMzkbWRFJ5TimJlgzfEGLmSudaYB-is4YG45vyztU5xL2VBgg__&Key-Pair-Id=APKAIE5G5CRDK6RD3PGA)
Distribution of T-cells in the PB and CSF. (*p ≤ 0.05; **p ≤ 0.01; ***p ≤ 0.001). Distribution of T-cells in the PB and CSF. Proportion [%] of the CD4+ T-cells (CD3+CD56−CD4+CH8-), HLA-DR+ CD4+ T-cells, CD8+ T-cells (CD3+CD56−CD4−CH8+) and HLA-DR+ CD8+ T-cells of the overall T-cells were determined by multiflow cytometry in HC (n = 24), NT1 (n = 12), NT2 (n = 7), and IH (n = 24). Levels are presented as median with 25% and 75% quartiles. The nonparametric Kruskal–Wallis and Dunn multiple comparison as a post-test were performed to test for differences (*p ≤ 0.05; **p ≤ 0.01; ***p ≤ 0.001). Activated HLA-DR+ CD4+ T-cells and HLA-DR+ CD8+ T-cells were significantly higher in NT1, NT2, and IH both in PB and CSF compared with HC. HC = healthy controls; NT1 = narcolepsy type 1; NT2 = narcolepsy type 2.
Although subsets of T-cells did not differ in the peripheral and intrathecal compartments among study groups, changes in their activation status were observed.
Activated HLA-DR+ cytotoxic CD8+ T-cells were significantly higher in all patient groups in both the peripheral and intrathecal compartments when compared with HC. Disease-related changes were also observed in HLA-DR positive helper CD4+ T-lymphocytes. Although activated CD4+ T-lymphocytes were also significantly elevated in both PB and CSF in all patient groups compared with HC, the proportion of activated CD4+ T-lymphocytes in CSF in all patient groups were even higher than in PB compared with HC. Furthermore, there were no differences in the proportion of activated cytotoxic CD8+ T-cell subsets and activated helper CD4+ T-cells in PB or CSF between the different patient groups (Table 3).
Overview of the activation status of different T-cell subpopulations between the study groups
| HC | NT 1 | NT 2 | IH | |||||
|---|---|---|---|---|---|---|---|---|
| Biomarker | PB | CSF | PB | CSF | PB | CSF | PB | CSF |
| CD4+ T-cells (mean % of T-cells) | 66.8 (8.0) | 73.7 (11.7) | 64,3 (11.2) | 74.7 (6.0) | 67.6 (12.2) | 70.6 (5.0) | 73.7 (9.1) | 75.6 (6.1) |
| HLA-DR+ CD4+ T-cells (mean % of CD4+ T-cells) | 4.5 (1.8) | 6.0 (2.8) | 6.9 (2.4) | 9.9 (5.2) | 6.3 (2.6) | 12.7 (6.7) | 6.4 (1.9) | 11.3 (4.1) |
| CD8+ T-cells (mean % of T-cells) | 26.7 (6.8) | 22.6 (6.8) | 28.2 (9.3) | 20.6 (4.8) | 24.4 (10.2) | 25.7(3.9) | 21.06 (8.3) | 20.4 (5.8) |
| HLA-DR+ CD8+ T-cells (mean % of CD8+ T-cells) | 7.1 (3.8) | 26.0 (10.3) | 12.0 (3.6) | 34.2 (12.0) | 11.6 (4.8) | 38.8 (8.6) | 15.3 (9.5) | 39.5 (13,2) |
| CD4/CD8 ratio | 2.7 (1.0) | 3.7 (1.5) | 4.5 (2.8) | 4.1 (1.6) | 2.7 (1.4) | 3.9 (1.1) | 3.5 (2.1) | 2.8 (0.6) |
T-cell subpopulations were determined by multiparameter flow cytometry. All data are given in percentages. Applying the Kurskal–Wallis and Dunn multiple comparison as a post-test, the distribution of T-cell subpopulations among the four study groups were compared. Bold letters represent p values lower than 0.05 which were considered as significant differences in the mean ranks of the T-cells across all groups.
Correlation of immunological markers with clinical and polysomnographic findings
To study the potential functional impact of activated T-cells on sleepiness, we correlated percentages of activated T-cells with clinical and polysomnographic parameters in all patient groups. In the group of NT1, a significant negative correlation between activated CD4+ and CD8+ T-cells in CSF and multiple sleep latency was found. Moreover, a significant correlation between activated CD4+ T-cells, as well as activated CD8+ T-cells, and ESS was found in both PB and CSF in the IH group (Table 4). No correlation was found between activated T-cells and CSF-hypocretin-1 levels or other polysomnographic parameters.
Correlation coefficients of activated T-cells with clinical, polysomnographic, and CSF parameters
| Biomarker | ESS | MSLT | CSF-hcrt.-1 |
|---|---|---|---|
| NT1 | |||
| aCD4+ PB | r = 0.352 | r = −0.535 | r = −0.327 |
| aCD4+ CSF | r = 0.187 | r= −0.581 (*) | r = −0.265 |
| aCD8+ PB | r = 0.112 | r = −0.495 | r = −0.300 |
| aCD8+ CSF | r = 0.276 | r = −0.577 (*) | r = −0.243 |
| NT2 | |||
| aCD4+ PB | r = 0.257 | r = 0.100 | r = 0.133 |
| aCD4+ CSF | r = 0.300 | r = −0,286 | r = 0.158 |
| aCD8+ PB | r = 0.342 | r = −0,149 | r = 0.258 |
| aCD8+ CSF | r = 0.306 | r = −0,288 | r = 0.109 |
| IH | |||
| aCD4+ PB | r = 0.212 | r = −0.191 | r = 0.155 |
| aCD4+ CSF | r = 0.471 (*) | r = −0.201 | r = 0.272 |
| aCD8+ PB | r = 0.406 (*) | r = −0.351 | r = 0.194 |
| aCD8+ CSF | r = 0.477 (*) | r = −0.313 | r = 0.115 |
Elevated levels of activated CD4+ and CD8+ T-cells in the CSF were negatively correlated with sleep latencies in the MSLT in people with NT1. In the IH group, higher levels of activated CD4+ T-cells in the CSF and activated CD8+ T-cells in both PB and CSF correlate with higher scores in the self-reported measurement of sleepiness in ESS. Bold values represent correlation that are statistically significant at *p ≤ 0.05 (Pearson correlation).
CSF-hcrt-1 = cerebrospinal fluid hypocretin levels; aCD4+ = HLA-DR positive-activated CD4+ T-cells; aCD8+ = HLA-DR+-activated CD8+ T-cells.
Discussion
This study shows that autoimmune mediated mechanisms may play a potential role in the pathogenesis of all types of CDH: We found a specific T-cell activation in both PB and CSF of people with CDH, including NT1, NT2, and IH. According to the literature [25, 26], the distribution of the investigated immune cell subsets differed between the peripheral and intrathecal compartments with a higher proportion of B-cells in the PB and a slightly increased proportion of all T-lymphocytes in the CSF in all groups.
Activated HLA-DR+ CD4+ and HLA-DR CD8+ T-cells in the PB and CSF were increased in people with hypersomnolence compared with HC irrespective of disease subtypes. These findings provide further evidence that T-cell mediated autoimmunity may be involved in the pathogenesis of not only NT1 and NT2, but also people with IH.
In NT1, the strong association with the HLA class II allele DQB1*0602 suggests a central role of CD4+ T-cells in this disease. As previously mentioned, the destruction of hypocretin-producing cells in the hypothalamus as a histopathological hallmark of NT1 is thought to result from an autoimmune attack. However, CD4+ T-cells which interact with HLA class II molecules are unlikely to cause this destruction as they do not, in general, have cytotoxic potential. Moreover, HLA class II molecules are expressed only by antigen-presenting cells such as B-cells, macrophages, and dendritic cells. Thus, it is more likely that HLA class I-restricted CD8+ autoreactive T-cells are the central effectors of specific neuronal destruction [8].
Following this hypothesis, two recent studies describe NT1-associated HLA-class I alleles which further supports a genetic basis of an autoimmune-mediated cytotoxic mechanism in NT1 [9, 27].
Evidence is accumulating that MHC I is expressed on neurons in the central nervous system, both on cell bodies and neurites [6]. In animal models, several studies have found an upregulation of MHC-I expression on neurons in response to a systemic inflammation [28, 29] in the presence of proinflammatory cytokines, particularly INFγ and TNAα [30]. In animal models, the functional relevance of upregulated MHC-I expression on neurons and the targeting by cytotoxic CD8+ T-cells in vivo has been shown by several studies [7, 31].
In humans, only isolated cases of narcolepsy have been documented in relation to a T-cell-mediated autoimmunity in the context of associated paraneoplastic encephalitis [32].
In all examined CSF samples of the different patient groups in our study, no pleocytosis or CSF-specific oligoclonal bands as a sign of intrathecal immunoglobulin synthesis or central nervous system (CNS) inflammation were found. Although the proportion of the overall CD4+ and CD8+ T-cells in PB and CSF did not differ between groups, the expression of the T-cell surface marker HLA-DR displays a phenotypic change both in the periphery and in CNS of people with CDH that has not been reported so far.
One study also described activated CD4+ T-cells in peripheral blood of people with NT114. Another study found the activation of T-cells with a trend to higher CD4+ cells in both CSF and peripheral blood with a more pronounced memory phenotype in the CSF compared with peripheral blood [33].
The present study demonstrates an upregulation of activation markers on helper CD4+ T-cells and cytotoxic CD8+ T-cells in both PB and CSF, indicating an involvement of both CD4+- and CD8+ T-cells in the CNS. These results are in line with a very recent finding that in people with NT1 and NT2, T-cells specifically target self-antigens of hypocretin neurons [34]. Previous studies in a narcolepsy mouse model demonstrated specific helper CD4+ T-cells which infiltrate the hypothalamus and, via an interaction with antigen-presenting cells, lead to a CD8+ cytotoxic T-cell–mediated destruction of neurons [31].
In a further step, we investigated the impact of activated T-cells in the patient group on clinical and polysomnographic parameters. Interestingly, we found a significant negative correlation of activated CD4+ T-cells and activated CD8+ T-cells in the CSF in the NT1 group with a shorter sleep latency in the MSLT (Table 4). Furthermore, higher levels of activated T-cells in the IH group correlate with higher scores of self-reported daytime sleepiness in the ESS (Table 4). Thus, this study indicates for the first time an association of activated CD4+ and CD8+ T-cells in the CNS with higher amounts of objective sleepiness in the NT1 group and self-reported sleepiness in the IH group.
Moreover, we found significantly elevated levels of total IgG in the CSF of people with NT1 and IH compared with HC with the highest levels of total IgG in the CSF of the IH group. These findings are partly in line with results of previous studies also describing abnormalities in immunoglobulins in PB of people with NT1, NT2, and IH [20]. Elevated levels of IgG in CDH might underlie the hypothesis of an increased susceptibility to specific infectious diseases. Higher titers of antistreptolysin I antibodies in people with narcolepsy after disease onset were reported. Further studies describe elevated specific hypocretin IgG autoantibodies against hypocretin 1 in NT1, in NT2, and IH [35]. In general, the role of autoantibodies in narcolepsy is controversially discussed. Some former studies failed to detect antibodies directly binding to Hcrt/Orx neurons [36, 37]. Autoantibodies against tribbles homolog 2 (TRIB2) antibodies were reported in 14% of people with narcolepsy [38]. As TRIB2 is expressed both in hypocretin neurons and in various cell populations in the CNS and in the periphery, a causative function of this antibody is doubted. Furthermore, it is hypothesized that autoantibodies are the result of secondary immune responses due to neuronal cell damage [39]. Contrary to this hypothesis, a recently published study in mice shows that autoantibodies might primarily contribute to a T-cell–triggered hypothalamic inflammation leading to NT1 phenotype [31].
Thus, additional studies are required to identify further autoantibodies which might induce T-cell–mediated hypothalamic neuronal damage. Until now, the functional relevance of both elevated levels of immunoglobulins and of activated helper CD4+ T-cells and cytotoxic CD8+ T-cells in the regulation of sleep/wake patterns in CDH is still unclear. Furthermore, the question of whether inflammatory markers like immunoglobulins or activated T-cells are a cause or a consequence of neuropathological changes still remains elusive.
It is still unclear whether sleepiness in narcolepsy is caused by a primary loss of hypocretin neurons and a low hypocretin tone reducing the wake-promoting system. Evidence emerges that melanin-concentrating hormone (MCH) and proopiomelanocortin (POMC) neurons have a functional connection to Hcrt/Orx neurons regulating sleep/wake patterns [40, 41].
Interestingly, beyond specific immune system activation in NT1, the present study also revealed a specific T-cell activation in NT2 and IH.
Whereas in NT1 the loss of hypocretin neurons is a hallmark in the pathogenesis, the neurobiology of sleepiness in NT2 and IH remains largely unclear.
Brain-specific autoantibodies against MCH- and POMC-cell populations, as well as a subset of antibodies against GABAergic hippocampal and neocortical interneurons, were found in sera of 27% of people with narcolepsy and—to a lower percentage—in people with other sleep-related disorders including IH [39].
In this context, it is interesting to consider what might render hypocretinergic- (Orx-), GABAergic, histaminergic, MCH-, and POMC neurons in the sleep/wake–promoting circuitry susceptible to T-cell mediated cell damage and what role autoantibodies in some cases might play in the process.
Limitations of the present study include the relatively long time delay of more than 6 months between symptom onset and biological sampling. As a result, the evidence of specific T-cell surface markers does not distinguish between acute, still ongoing, or subsided inflammatory processes. Furthermore, the influence of HLA status in HC was not explicitly investigated as a potential effector to autoimmunity.
We investigated the impact of activation levels of T-cells on clinical symptoms such as sleepiness. In this study, we could not show a significant correlation of activated T-cells and sleepiness measured by questionnaires (ESS) or by polysomnography (multiple sleep latency). Thus, the functional relevance of activated T-cells and its impact on clinical symptoms remain to be elucidated. In this context, the quantification of activation levels of lymphocytes close to symptom onset, its progress over several months, and the correlation with clinical symptoms and polysomnographic measurements would broaden our understanding of the underlying pathophysiology, potentially having profound consequences on current diagnostic and treatment approaches.
In conclusion, this study supports the hypothesis that autoimmune and T-cell–mediated processes might contribute to the complex pathogenesis of not only NT1, but also NT2 and IH.
The expression of the T-cell activation markers in our study was not limited to the intrathecal compartment. We observed elevated levels of HLA-DR+ CD4+ and HLA-DR CD8+ T-cells in PB that significantly correlated with elevated levels in the CNS. As an activation of both CD4+ and CD8+ T-cells has been previously reported in NT1 [14], it might be possible that in early disease stages T-cells are activated in the periphery and then transmigrate across the BBB. Therefore, future projects should aim to identify specific cellular immune markers like T-cell activation markers in early stages of the disease both in PB and CSF. These observations might help establish specific cellular immune surface markers as biomarkers for early diagnosis and, in a second step, specific immune-modulating approaches.
Funding
The work presented in this article was performed by the authors as an internal research study.
Conflict of interest statement. Dr. Julian Lippert has no financial disclosures. Univ.-Prof. Dr. Peter Young received speaker honoraria from Ärztekammer Nordrhein, Bayer Vital; Beurer GmbH, Genzyme GmbH/Sanofi Aventis, Heinen u. Löwenstein, Höfermedia, Neuro-Consil, UCB, Vanda. Dr. Catharina C. Gross received speaker honoraria and travel expenses for attending meetings from Biogen, Euroimmun, Genzyme, and Bayer Health Care. Her work is funded by the German Ministry for Education and Research (BMBF; 01GI1603A), the German Research Foundation (DFG; GR3946/3-1 and SFB/Transregio 128 A09), and the European Union (Horizon2020, RESTORE). Univ. Prof. Dr. Sven Meuth has received honoraria for lecturing, travel expenses for attending meetings, and financial research support from Almirall, Amicus Therapeutics Germany, Bayer Health Care, Biogen, Celgene, Diamed, Genzyme, MedDay Pharmaceuticals, Merck Serono, Novartis, Novo Nordisk, ONO Pharma, Roche, Sanofi-Aventis, Chugai Pharma, QuintilesIMS, and Teva. Dr. Bianca Dräger received honoraria from Genzyme and Biogen. Dr. Anja Schirmacher has no financial disclosures. Dr. Anna Heidbreder received honoraria for lecturing from UCB, Bioprojet, Servier, and Vanda.


Comments