


Abstract
There is a lack of consensus on how next-generation sequence (NGS) data should be considered for phylogenetic and phylogeographic estimates, with some studies excluding loci with missing data, whereas others include them, even when sequences are missing from a large number of individuals. Here, we use simulations, focusing specifically on RAD (Restriction site Associated DNA) sequences, to highlight some of the unforeseen consequence of excluding missing data from next-generation sequencing. Specifically, we show that in addition to the obvious effects associated with reducing the amount of data used to make historical inferences, the decisions we make about missing data (such as the minimum number of individuals with a sequence for a locus to be included in the study) also impact the types of loci sampled for a study. In particular, as the tolerance for missing data becomes more stringent, the mutational spectrum represented in the sampled loci becomes truncated such that loci with the highest mutation rates are disproportionately excluded. This effect is exacerbated further by factors involved in the preparation of the genomic library (i.e., the use of reduced representation libraries, as well as the coverage) and the taxonomic diversity represented in the library (i.e., the level of divergence among the individuals). We demonstrate that the intuitive appeals about being conservative by removing loci may be misguided. [Next-generation sequencing; phylogenetic; phylogeography; RADseq; RADtags; species delimitation.]
Multilocus data sets now dominate phylogenetic studies, spurred by shifts in the technologies used to gather sequence data, as well as the general recognition of the value of multiple independent loci for phylogenetic study ( Pamilo and Nei 1988 ; Cummings et al. 1995 ; Maddison 1997 ). Next-generation sequencing technologies—RAD sequencing (RADseq) ( Baird et al. 2008 ) in particular, allows researchers to collect unprecedented amounts of multilocus sequence data irrespective of whether the taxa have any preexisting genomic resources. However, accompanying the dramatic increases in the amount of genomic data that can be readily collected across multiple species are also much larger amounts of missing data (e.g., Rubin et al. 2012 ; Eaton and Ree 2013 ; Wang et al. 2013 ) compared with traditional Sanger sequencing that amplifies and generates data for each locus and individual separately. Moreover, the nature of the missing data also differs.
In studies employing traditional sequencing approaches, decisions about missing data tend to focus on whether to delete a taxon from a data matrix ( Roure et al. 2013 ). For example, in supermatrix studies with mixed representation of loci across taxa, the concern is whether species with limited sequence data across loci (e.g., a few mitochondrial markers) would lead to a poorly resolved phylogeny ( Bininda-Emonds et al. 2002 ; Wiens 2003 ). In contrast, the primary decision with data generated with next-generation sequencing methods is whether to delete a locus from a data matrix because of missing sequences across the individuals in a study.
With a finite number of sequencing reads spread across multiple individuals in next-generation sequencing data sets, there can be large variation among loci in the amount of missing data ( Fig. 1 ). For example, a HiSeq Illumina run may generate 140 million reads. However, when those reads are spread across individuals and across loci, just by chance, each locus will have missing sequences in some individuals (even if individuals have equal concentrations of genomic DNA; Fig. 1 ). Because of the technologies involved in constructing reduced representation libraries, missing data are also expected to be nonrandomly distributed across species, with the amount of missing data proportional to the genetic distance between taxa. For example, restriction enzymes are often used to construct the reduced representation libraries in RADtag protocols (also known as RADseq; Baird et al. 2008 ). Some taxa might have null alleles generated by either mutations at enzyme-cutting sites ( Fig. 1 a) or newly mutated enzyme-cutting sites that turn larger fragments into smaller ones that fall out of the size-selection range. The likelihood of such mutations will depend on the overall sequence similarity of species ( Rubin et al. 2012 ). Even for protocols that generate missing data on a much smaller scale, such as ultra-conserved elements (UCEs), the probability that the probes will work differs as a function of the evolutionary distance among species ( Faircloth et al. 2012 ; Lemmon et al. 2012 ). Missing data from next-generation sequencing could also be generated by the data processing step. For example, with the high error rate in next-generation sequencing compared with traditional Sanger sequencing, one common practice is to require a minimal number of reads (i.e., a coverage threshold) to ensure the genotype is properly detected at given locus. Loci in individuals below the coverage threshold will not be represented in the processed data set ( Fig. 1 b). Furthermore, assembling reads from next-generation sequencing, either de novo or by mapping to a reference genome, relies on sequence similarity ( Catchen et al. 2011 ). Identity cutoffs are often applied to avoid nonorthologous assemblies ( Rubin et al. 2012 ), so alleles with greater divergence among individuals (or relative to the reference genome) may be excluded ( Fig. 1 c), especially for more distantly related taxa.
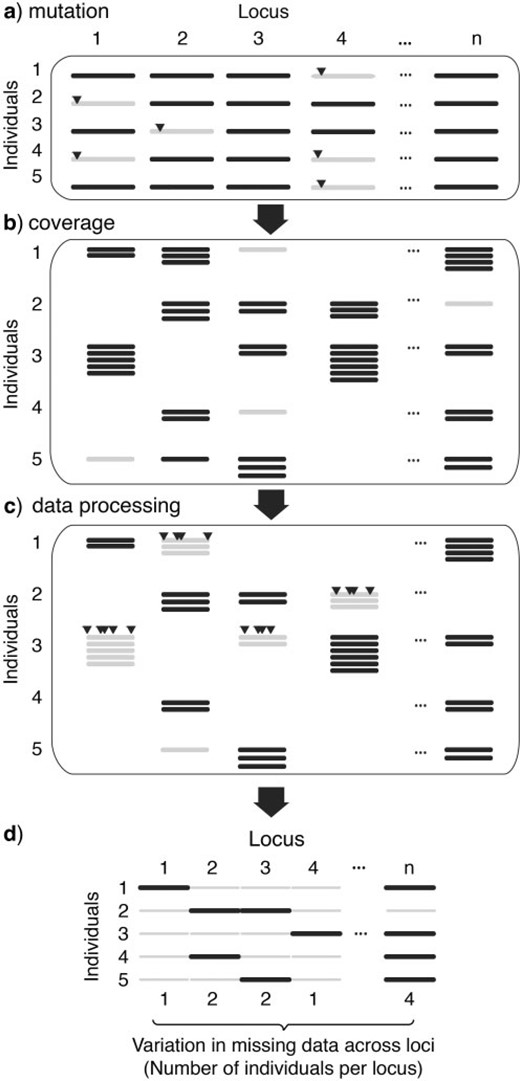
Schematic of the different factors that can contribute to loci with missing data in RADseq. Missing data (shown in gray) may result from: a) mutations at enzyme-cutting sites (triangles), b) the shot-gun nature of next-generation sequencing, where the amount of missing data will depend on the number of reads per locus per individual, and c) data processing of sequences, such as when there are fewer reads per locus than the required minimal depth (see locus 2 of sample 5) and when there are too many variable sites per locus (shown as triangles). The final data matrix available for phylogenetic analysis d) will consist of loci that are missing across individuals to varying degrees (the focus of this article). Although not investigated here, there may also be differences in the number of loci across individuals associated with unequal concentrations of DNA in the genomic preparations of individuals, which could affect phylogenetic analyses.
These issues raise the question of how we should treat missing data when we use next-generation sequences for phylogenetic and phylogeographic studies. Not only has the issue of nonrandomly distributed missing data received limited study (see Rubin et al. 2012 ; Hovmöller et al. 2013 ), but current studies also differ in how they handle such missing data. Some studies remove loci when sequences for a locus are missing from some sampled individuals (e.g., McCormack et al. 2012 ; Zellmer et al. 2012 ). Such a decision is often viewed as a more conservative approach to making historical inferences, whereas others opt to include loci with missing data in their analyses, even when the data are missing in a large proportion of the individuals in the study ( Emerson et al. 2010 ; Wagner et al. 2013 ). Despite the lack of a consensus on whether to include or exclude loci with large amounts of missing data, it is clear that such decisions affect the results. For example, both the phylogenetic resolution and support for species relationships of cichlids from the Lake Victoria radiation differ considerably when loci with missing data were included (vs. excluded), as did the delimitation of the individual species themselves ( Wagner et al. 2013 ). What is not clear is whether the observed effects of including loci with missing data in such empirical studies also correspond to more accurate inferences. Simulation studies can address such questions because they provide the requisite framework to assess accuracy—a known history can be compared with estimated histories when excluding loci with a given amount of missing data.
Here, we present the results of a simulation study to specifically address the question of whether we are being conservative (i.e., guarding against errors in our estimates) when we opt for more complete data sets and throw out loci with missing data. We focus on how different tolerances for missing data from RADseqs impact: (i) the properties of genomic data sets used in phylogenetic studies, (ii) the detection of monophyletic taxa, and (iii) the accuracy of phylogenetic inferences. We chose to focus on phylogenomic data sets generated using RADseqs given their broad applicability across taxa and their popularity in recent empirical applications (e.g., Eaton and Ree 2013 ; Wagner et al. 2013 ), and also because of their general accessibility to independent researchers (as with UCEs; e.g., Smith et al. 2014 ), in contrast with the limited accessibility of certain approaches like anchored hybrid enrichment for generating phylogenomic data (e.g., Lemmon et al. 2012 ). We also focus on RADseq because the technology generates data sets with large numbers of loci and large amount of missing data compared with other next-generation sequencing technologies. Our results reveal some unforeseen consequences of excluding missing data, which can be further exacerbated by decisions researchers make during library preparation and data processing of the genomic data.
Methods
Simulation of Missing Data
Because this study focuses on RADseq, we conducted simulations that approximate the type of data that researchers would obtain from sequencing RADtag libraries on the Illumina platform. Complete data sets without missing data were first simulated, and a series of manipulations of these data sets were then conducted that capture some of the factors that can lead to missing data ( Fig. 1 ). Different thresholds for missing data were applied to study the effects of excluding loci with missing data on downstream phylogenetic analyses. We note that not all potential factors that might contribute to missing data are represented in the simulations (see Results and Discussion).
The complete data sets were simulated by: (i) generating 20 different species trees of 8 taxa under a Yule birth-and-death model with Mesquite ( Maddison and Maddison 2011 ) and (ii) scaling the total depth of each species trees to 2 N and 20 N generations (to enable consideration of how decisions about excluding missing data may impact phylogenetic inferences differently depending upon the amount of sequence divergence among taxa). For each species tree at each depth, (iii) 10,000 coalescent genealogies that sample 12 haplotypes per species were simulated using the program ms ( Hudson 2002 ), and on each genealogy, (iv) sequences of 98 basepairs (bp) were simulated using the program Seqgen ( Rambaut and Grassly 1997 ) with a mutation rate randomly drawn from a lognormal distribution with a mean θ of 0.005 (θ = 4 N μ, where N is the effective population size and μ is the mutation rate) and a log standard deviation of 1.3 (i.e., θ = 0.002 and 0.012 for the 25th and 75th percentile, respectively).
Based on the simulated complete data sets, data matrices with missing data were constructed to account for three factors that would act in concert to generate missing data (sequentially represented in panels of Fig. 1 ). The first is the possibility of a mutation at the enzyme-cutting site ( Fig. 1 a). By considering the first 8 bp of the sequence as the enzyme-cutting site, an individual was deleted for a particular locus if its sequence contained a mutation in this 8 bp ( Fig. 1 a). The following simulations only used the rest of the 90 bp (i.e., the invariant enzyme-recognition sites were cleaved).
To generate data sets with missing data that reflects the shotgun nature of next-generation sequencing, we randomly draw the number of reads for each individual sequence at each locus from a Poisson distribution, which results in different individuals without a sequence across loci ( Fig. 1 b). We set the mean of the Poisson distribution to 5 (i.e., 5 × coverage for haploid states), which is commonly considered as an efficient coverage for NGS studies ( Nielsen et al. 2011 ). Individuals with no reads for a given locus were deleted for that locus from the data matrix. Using the same procedure, we also simulated and analyzed data sets with the extremely low coverage of 1 × (which was suggested for some population genetics studies; Buerkle and Gompert 2013 ). With these two coverage settings, we can explore the extent of reduction in data matrix size when researchers make different choices about coverage during the preparation of the library.
Finally, we generated data sets to examine how the processing of data prior to phylogenetic analyses might contribute to missing data (hereafter referred to as post-sequencing missing data; Fig. 1 c). Current NGS studies differ considerably in how data are processed in terms of the bioinformatics tools used and their parameter settings. To approximate the amount and the property of missing data generated in the data processing stage, we focused on two steps ( Fig. 1 c). One is the minimum read depth across an allele for inclusion in a processed data set, that is, the setting used in a software package as the minimal depth of coverage to create a “stack” or “allele” ( Catchen et al. 2011 ; Hird et al. 2011 ). The other step involves the processing of sequence data to identify orthologous loci across individuals. In general, this setting refers to the maximum sequence divergence allowed across reads and is commonly applied to avoid creating artificial loci with nonorthologous reads (e.g., reads from different members of a gene family; Langmead et al. 2009 ; Catchen et al. 2011 ). The post-sequencing data sets were generated by dropping individual sequences from the data matrix that had less than two reads and that exceeded the maximum divergence of either 2 or 5 nt differences, for the 2 N and 20 N divergence scenarios, respectively (for each locus, one sequence from the data matrix was randomly selected as the centroid for measuring divergence; Fig. 1 c).
Analyses
The effect of excluding loci with missing data on (i) the size of the data matrix (i.e., the number of loci) and (ii) the properties of the data set (i.e., impact on the mutational spectrum represented in the data set) was examined. For each set of simulated data sets that correspond to the three sources of missing data described above, we calculated the size of data matrix when using different tolerance levels for missing data (i.e., the minimum number of individuals with sequences for a locus to be included), examined the distributions of mutation rates of intact loci after accounting for different sources of missing data, and compared them with the initial distribution used for simulation. Because both the length of genealogy and its mutation rate determine the amount of genetic variation in a RAD locus, we also examined the changes in the distribution of genealogy depth among loci.
The effect of excluding loci with missing data on the monophyly of taxa and phylogenetic accuracy was examined using different subsets of the 10,000 simulated loci to separate out the effects attributable to (i) data set size and (ii) biases in the mutational spectrum that result when loci are selected based on their level of missing data. For these analyses, we rank ordered the loci according to the level of missing data (the number of individuals without a sequence for a given locus). For each species tree, we first applied different tolerances for missing data to generate two data sets that differ in size and their respective mutational spectrums. A small data set with nearly complete sampling was created (i.e., loci are present in ≥ 99% of individuals). Although the exact number of such loci differed across species trees, on average there were 398 and 253 loci with nearly complete sampling for species trees at 2 N and 20 N depth, respectively. A large data set with more missing data, specifically, loci that are present in more than half of the individuals, was generated and contained on average 7814 and 5618 loci across the species trees with 2 N and 20 N divergence, respectively. To identify the specific effect of biases in the mutational spectrum across loci (as opposed to differences in data set size), we generated additional data sets that contained an equal number of loci as the data set with nearly complete sampling (the data sets with 398 to 263 loci referred to above), but the loci for these data sets were randomly sampled from subsets of the original 10,000 loci with higher tolerances for missing data. Specifically, three such data sets were generated for each species tree where the different tolerances used to define subsets of loci with different mutational spectrums were the inclusion of loci if they were present in ≥ 12.5%, ≥ 25%, and ≥ 50% individuals. To provide insight into the effects of including a lot of loci, but loci with very large amounts of missing data on phylogenetic inferences, as opposed to smaller numbers of loci with less missing data, we also generated two additional large data sets of loci missing in up to 75% and 99% of the individuals (i.e., present in at least one individual). In total, there were seven data sets generated for each species tree, and measurements of monophyly of taxa and phylogenetic accuracy were averaged across species trees at the same depth for each type of data set (see below).
The average number of monophyletic species in the simulated species trees was calculated from phylogenetic estimates of the concatenated loci for each data set generated from RAxML v7.2.6 with the rapid bootstrap option ( Stamatakis et al. 2008 ). Best-scoring ML gene trees were estimated with the GTRGAMMA substitution model, and bootstrap support based on 100 replicates was used to identify well-supported monophyletic taxa (i.e., nodes with bootstrap values of 70% or greater; Taylor and Piel 2004 ). Due to computational limits, 2500 loci were randomly sampled from the large data sets for phylogenetic estimation (i.e., those with an average of 7814 and 5618 loci across the species trees with 2 N and 20 N divergence, respectively).
We also did a separate analysis for evaluating phylogenetic accuracy, given that the RAxML 96-taxon (12 haplotypes per species) trees are not directly comparable to an 8-taxon species tree when species are not monophyletic. For these analyses, species trees were estimated using the shallowest divergence method ( Takahata 1989 ). The distance between species or clades was calculated as the average minimal number of nucleotide differences (among all sampled individuals) across multiple loci (see also Maddison and Knowles 2006 ) and a clustering algorithm was used to iteratively group species and/or clades with minimal distances. The accuracy of phylogenetic estimates was evaluated by calculating the Robinson–Foulds distance ( Robinson and Foulds 1981 ) between the estimated species trees and the actual species trees used to simulate the sequences. With this approach, species/clades with identical sequence divergences, which were frequently encountered in the smaller data sets for species trees at the shallow divergence of 2 N , were considered as a polytomy (i.e., a lack of phylogenetic information; see also Yu et al. 2011 ) instead of randomly clustering one of the tie pairs (as in Maddison and Knowles 2006 ). As such the method used here to estimate the species tree has properties that make it appealing for this particular application. However, we recognize that other methods might be used to estimate species trees (or to estimate gene trees for discovering monophyletic species, as described in the previous paragraph). We note that all the findings on factors that impact the data matrix for downstream phylogenetic inference would apply broadly, irrespective of which particular methods are used. Similarly, although the absolute magnitude of effects of missing data might shift with different methods of analysis ( Knowles et al. 2012 ), the relative impact on the accuracy of phylogenetic inference associated with the treatment of missing data will still provide insight.
Results andDiscussion
Data Matrix Size
The ultimate size of the data matrix from RADseq depends on multiple factors, including the amount of sequence divergence among the individuals/taxa included in the study, the coverage and post-sequencing processing decisions about the reads, and the tolerance for missing data set by the researcher ( Fig. 2 ). Although it is obvious that different tolerances for missing data will directly impact the data matrix size ( Fig. 2 ), the rate of change in the size of the matrix depends on both the coverage and the divergence history. Specifically, as the tolerance for missing data increases, the size of the data matrix increases exponentially for recently diverged taxa ( Fig. 2 a) compared with a more linear rate of increase for older species divergences ( Fig. 2 b). Moreover, decisions in the preparation of the library, such as the number of samples to multiplex into an Illumina lane, will affect the coverage, and hence impact the data matrix size.
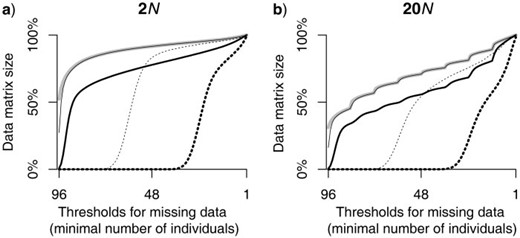
As the tolerance for missing data increases, the size of the data matrix increases (presented as the percentage of the original 10,000 independent loci retained). The data set size changes exponentially for recently diverged taxa a) compared with a more linear rate of increase for older species divergences b), as shown for a total tree depth of 2 N and 20 N , respectively. The thick gray line in each plot represents the amount of missing data due to mutations at enzyme-recognition sites. The thin black line (which mostly overlaps with the thick gray line) shows the amount of additional missing data generated during sequencing when targeted coverage is 5 × , and the thick black line represents the amount of missing data after data processing. In each plot, the changes in the size of data sets with reduced coverage (i.e., 1 × coverage) is shown by the thin dashed line, and the thick dashed line shows the corresponding amount of missing data after data processing for a data set with 1 × coverage.
For any given tolerance level of missing data, a library sequenced at lower coverage will result in a smaller data matrix. These results should not be taken as evidence that the “right” coverage should be high versus low; such decisions are going to depend upon the intended use of the data. For example, phylogenetic inference might be rather robust to the sequencing errors that go undetected with low coverage, whereas the negative impact of such errors on applications that rely on accurate detection of rare polymorphism, such as disease mapping, may be significant. It is also noteworthy that overly stringent criteria (i.e., almost complete representation of locus across individuals) will result in significant reductions in the data matrix size because of mutations at the enzyme-cutting site, irrespective of the coverage used to generate the library ( Fig. 2 , gray lines).
These effects highlight the downstream consequences of decisions made during the construction of the library and processing of the data. However, because of the dependency of data matrix size on the divergence history of the taxa themselves (see also Rubin et al. 2012 ), there is no rule-of-thumb to follow when using RADseqs for phylogenetic analysis. For instance, if researchers apply the same tolerance for missing data, the data matrix will be smaller if the divergence history is older. Likewise, in real data sets, larger amounts of data might be eliminated than demonstrated here ( Fig. 2 ) because of other factors that might contribute to missing data and impact the property of the data sets. For example, we did not model the probability of newly mutated enzyme-cutting sites that produce shorter fragments outside the size selection range, or the probability of restriction methylation that could generate different sets of fragments even without a mutation ( Reyna-Lopez et al. 1997 ). Although our study does not provide information on all the possible sources of missing data, the factors we investigated are general properties associated with library construction and post-processing of sequences, and in that sense, are broadly relevant to any RADseq study. Moreover, the protocol for this study could be used by any researcher to investigate how other specific factors contribute to missing data.
Distribution of Mutation Rates Represented across Vetted Loci
When we include loci based on whether they are present in some or most of the individuals in the data matrix, we introduce a bias in the type of loci included in the phylogenetic analysis. Specifically, we shift the distribution of mutation rates represented across loci ( Fig. 3 ). For example, by analyzing the different simulated data sets we can show that mutations in the enzyme-cutting site used to construct the library and the post-sequence processing contribute individually to a shift in the distribution of mutation rates across loci. The cumulative effect of these factors is a clear loss of loci with high mutation rates ( Fig. 3 ). Consequently, when we are conservative, we may be removing some of the loci that might be especially informative for phylogenetic analyses (see below). Theoretically, both genealogical depth and mutation rate determine the level of genetic variation among sampled individuals at a given locus (see Huang et al. 2010 ). For the divergence scenarios considered here, the shift in the spectrum of mutation rates that occurs when loci with missing data are excluded appears to be the primary factor that impacts downstream phylogenetic inference, given the apparent lack of a significant shift in the distribution of genealogy depth (online Appendix 1; available from http://www.sysbio.oxfordjournals.org/ , http://dx.doi.org/10.5061/dryad.jf361 ). However, under other scenarios, such as extremely shallow divergence where large ancestral population sizes may contribute fairly deep trees, or when divergence with gene flow results in relatively shallow depths, the impact of excluding missing data on the observed distribution of genetic variation may be greater because of the additional truncation of the distribution of genealogies.
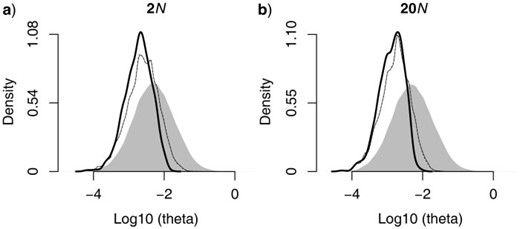
Density distribution of mutation rates, μ, across loci (shown as a function of θ, where θ = 4 N μ) for shallower and older species divergence histories (i.e., 2 N and 20 N , respectively). The gray shaded area represents the original density distribution of mutation rates in the simulated data set, whereas the lines represent the shift in the mutational spectrum that results from different sources of missing data. In each plot, the cumulative effect of missing data arising from both mutations at the enzyme-cutting site and post-sequence processing is shown by the thick black line, whereas the shift in the distribution due to mutations at the enzyme-cutting cite alone is shown as the thin gray line. The magnitude of the shift in the spectrum of mutation rates is greater for deeper divergences (b) relative to recent divergences (a).
Downstream Phylogenetic Consequences of Excluding Loci with Missing Data
When we exclude loci, the impact on phylogenetic analyses may be significant because of the reduced amount of information available relative to the larger data sets when loci with missing data are included ( Fulton and Strobeck 2006 ; Wiens 2006 ; Rubin et al. 2012 ; Hovmöller et al. 2013 ). As with loci obtained from traditional sequencing approaches, the effect of the size of the data matrix is readily apparent on the number of monophyletic taxa estimated from a maximum-likelihood gene tree from the RADseqs ( Fig. 4 ; see also Wagner et al. 2013 ). However, an additional impact of vetting loci based on their level of completeness is also apparent. Even for data sets of the same size, the shift in the distribution of mutation rates represented across loci results in fewer monophyletic taxa being detected ( Fig. 4 ). Evaluation of the accuracy of species relationships ( Fig. 5 ) also illustrates the impact of the bias in mutation rates represented among loci when excluding loci with missing data. Specifically, for the same number of loci, selecting loci with the least missing data results in a lower accuracy of estimated phylogenetic relationships. Note that this unforeseen consequence of vetting loci, however, is not as nearly as large as the effect of size of the data matrix on phylogenetic accuracy. Interestingly, for the diversification scenarios examined here, we did not detect a substantial difference in the accuracy of species relationships estimated for the large data sets (i.e., thousands of loci) even when including loci with extremely large amounts of missing data ( Fig. 5 ). This finding, together with previous observations that sampling multiple individuals increases the accuracy of phylogenetic inference, especially for recent divergent histories (e.g., Maddison and Knowles 2006 ; Heled and Drummond 2010 ), suggests the potential benefits of put more individuals into a illumine lane, even if it comes at the cost of lower coverage per locus per individual. Yet, this speculation still needs to be thoroughly investigated with more comprehensive simulations where the number of sampled individuals covaries with the sequencing coverage, and the proportional increase in sequencing errors with lower coverage is considered, before we can begin to understand the minimum coverage required for accurate phylogenetic inference.
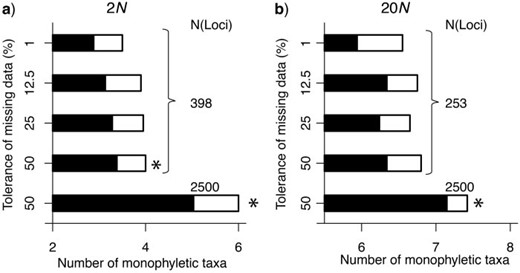
The number of monophyletic taxa on ML gene tree estimated for each of the data sets with different sizes and different tolerances of missing data (i.e., different mutational spectrums). For a given number of loci, fewer monophyletic taxa were detected in data sets that only include loci with almost no missing data. The number of monophyletic taxa also depends on the data set size and the timing of species divergence, with fewer monophyletic taxa identified for the shallow divergent history of 2 N (a) compared with the deeper divergent history 20 N (b). The number of monophyletic taxa and the number of loci are averages across 20 species trees used in the simulations. The black proportion of the bars represents the average number of well-supported monophyletic taxa (bootstrap values ≥70%); the asterisks mark the data sets with significant increases in the number of monophyletic taxa compared with the conservative approach of tolerating only 1% missing data (based on a Wilcoxon-paired sign rank test).
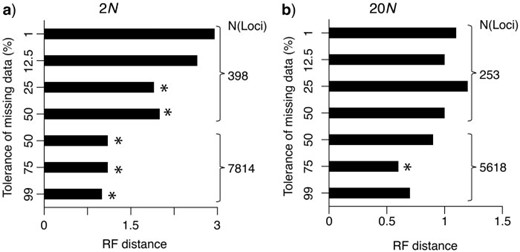
The topological difference (i.e., RF distances) between the estimated and true species tree for each of the data sets with different sizes and different tolerances of missing data. The RF distances and the number of loci are averages across the 20 simulated species trees with (a) 2 N and (b) 20 N divergence; the asterisks mark data sets with significant decreases of the RF distances (i.e., more accurate phylogenetic inferences) compared with the conservative approach of tolerating only 1% missing data (based on a Wilcoxon-paired sign rank test).
Conclusions
Our results show how decisions made by researchers during the construction of libraries and processing of data, as well as the divergence history itself, impact not only the size of the data matrix, but also properties of the data set with respect to the distribution of mutation rates represented among loci. We also demonstrate that when researchers vet loci with a low tolerance for missing data, information is lost from both a reduced data set size and a biased representation of the mutation spectrum among screened loci. Hence, contrary to our intuition, these “conservatively” selected loci could be no better than a set of randomly selected loci ( Figs. 4 and 5 ) in terms of phylogenetic accuracy. Our analysis complements observations from recent empirical studies. For example, Wagner et al. (2013) found that larger data matrices, despite their large amount of missing data, result in better resolution in delimiting Lake Victoria cichlid species, and Rubin et al. (2012) discovered that the higher proportion of missing data in larger data matrices does not adversely affect phylogenetic accuracy using in silico digestion of Drosophila genomes. Our work provides insights into how both the size of the matrix and the data matrix properties may contribute to such observations.
Given that the data matrix reflects complex interactions between aspects of library construction and processing with the divergence history itself (see Figs. 2 and 3 ), our results also suggest that general rules-of-thumb are unlikely. For example, the answer to questions like what level of coverage would maximize the size and quality of a data matrix for phylogenetic analysis would depend on the specifics of each study. Nevertheless, an understanding of the impact of specific factors associated with the generation and processing of next-generation sequencing data, as shown here, can be achieved on a study-by-study case basis through simulation.
How to deal with missing data has been a long-standing question for phylogenetic studies (e.g., Wilkinson 1995 ). This is the first investigation to understand what specific effects missing data have when inferring phylogeny from the short sequence reads, where most of the phylogenetic information is contained in single-nucleotide polymorphisms (SNPs). This work complements recent investigation into the utility of RADseqs for phylogenetic inference more generally ( Rubin et al. 2012 ), and the more intensive studies on RADseqs and missing data on SNP calling and population genetic parameter estimation ( Arnold et al. 2013 ; Buerkle and Gompert 2013 ). However, much more study will be needed before we will be able to understand how much missing data is too much for accurate phylogenetic inference. Given how long this issue has been debated with respect to traditional Sanger sequences ( Roure et al. 2013 ), a simulation approach, such as the one described here, is the first step toward an understanding of the impact of missing data on phylogenetic inferences based on next-generation sequencing.
SupplementaryMaterial
Supplementary material, including scripts and simulated data sets, can be found in the Dryad data repository at http://dx.doi.org/10.5061/dryad.jf361 .
Funding
This work was supported by National Science Foundation (NSF) grant [DEB 11-18815 to L.L.K.].
Acknowledgements
Thanks to members of the Knowles laboratory, especially to Qixin He for helpful discussions on the topic and suggestions. This research also benefitted from valuable comments from Brant Faircloth and an anonymous reviewer.
References
Author notes
Associate Editor: David Posada
