


Abstract
The biological half-life (t1/2) of methylmercury (MeHg) shows considerable individual variability (t1/2 < 30 to > 120 days), highlighting the importance of mechanisms controlling MeHg metabolism and elimination. Building on a prior physiologically based pharmacokinetic (PBPK) model, we elucidate parameters that have the greatest influence on variability of MeHg t1/2 in the human body. Employing a dataset of parameters for mean organ volumes and blood flow rates appropriate for man and woman (25–35 years) and child (4 − 6 years), we demonstrate model fitness by simulating data from our prior controlled study of MeHg elimination in people. Model predictions give MeHg t1/2 of 46.9, 38.9, and 31.5 days and steady-state blood MeHg of 2.6, 2.6, and 2.3 µg/l in man, woman, and child, respectively, subsequent to a weekly dose of 0.7 µg/kg body weight. The major routes of elimination are biotransformation to inorganic Hg in the gut lumen (73% in adults, 61% in child) and loss of MeHg via excretion within growing hair (13% in adults, 24% in child). Local and global sensitivity analyses of model parameters reveal that variation in biotransformation rate in the gut lumen, and rates of transport between gut lumen and gut tissue, have the greatest influence on MeHg t1/2. Volume and partition coefficients for skeletal muscle (SM) and gut tissue also show significant sensitivity affecting model output of MeHg t1/2. Our results emphasize the role of gut microbiota in MeHg biotransformation, transport kinetics at the level of the gut, and SM mass as moderators of MeHg kinetics in the human body.
Mechanisms of methylmercury (MeHg) toxicity in humans remain incompletely understood and yet have a great impact on understanding a priority environmental health issue (Bjorklund et al., 2017; Karagas et al., 2012). The primary route of human MeHg exposure is though consumption of fish, seafood, and ocean mammals (Kim and Zoh, 2012) (hereafter, collectively referred to as “fish”). Results from a number of epidemiological studies of fish-eating populations have shown that the effects of MeHg exposure on people can vary widely (Davidson et al., 2008; Debes et al., 2006; Karagas et al., 2012; Strain et al., 2008), which has ultimately contributed to uncertainty in how to advise individuals on fish consumption (Rideout and Kosatsky, 2017). This uncertainty has also highlighted fundamental toxicological questions about the nature of intrinsic variability in MeHg toxicokinetics in humans, ie, in rates of absorption, distribution, metabolism, and excretion (reviewed in Rand and Caito, 2019). In adults, MeHg elimination (the combined effect of excretion and biotransformation to inorganic Hg [iHg]) occurs with a biological half-life (t1/2) of approximately 45 days, which equals an elimination rate (kel) of ∼0.015 day−1 (or 1.5% of the body burden eliminated per day) (Caito et al., 2018; Smith et al., 1994). However, values ranging from t1/2 < 30 days to more than 120 days are found across several studies (Birke et al., 1972 and reviewed in Rand and Caito, 2019). Kinetic principles dictate that the t1/2 directly influences the steady-state concentration of MeHg in the body that occurs with repeated exposures (eg, weekly fish consumption). Resolving the mechanisms controlling the variability in MeHg metabolism and elimination is therefore essential for identifying susceptible individuals and developing approaches to reducing the internal dose of MeHg that comes with fish eating.
Improved methods for longitudinal analysis of Hg in hair using laser ablation ICP-mass spectrometry (Rand et al., 2016) have facilitated experimental approaches to quantify individual MeHg elimination kinetics in people (Caito et al., 2018). Our prior studies have implemented a controlled intervention, where participants consume three meals of fish, each portion one-week apart, followed by a two-month period of elimination with no fish consumption (Caito et al., 2018; Rand et al., 2016). Evaluation of more than 40 subjects over two studies shows an average MeHg t1/2 = 44 days and a range of of t1/2 = 28–128 days (Caito et al., 2018; Rand et al., 2016). Interestingly, within-subject variability over time was observed in several cases (Rand et al., 2016). Additionally, two subjects exhibited a slowing in MeHg elimination rate subsequent to taking antibiotics (Caito et al., 2018), consistent with rodent studies that have implicated a role of gut microbes in biotransformation and elimination of MeHg (Rowland et al., 1977, 1984). Nonetheless, mechanisms that cause such variation in human MeHg metabolism and elimination kinetics remain poorly characterized.
Additional insight into the toxicokinetics of MeHg has come from physiologically based pharmacokinetic (PBPK) modeling. The advent of PBPK modeling has greatly advanced fields of basic and clinical pharmacokinetics (Gerlowski and Jain, 1983; Theorell, 1937), yielding an approach to predict time-dependent distribution of drugs in human tissue compartments. Extending PBPK approaches to the field of toxicology has similarly contributed to understanding of fundamental toxicokinetic mechanisms while also advancing the field of risk assessment (Campbell et al., 2012). For example, Farris et al. (1993) by constructing and validating a PBPK model in conjunction with experimental data from rats receiving a tracer dose of 203Hg-labeled MeHg, accurately simulated the transport and disposition of MeHg and its primary biotransformation product iHg. This study affirmed the importance of mechanisms such as biotransformation (de-methylation) of MeHg occurring in the gut lumen for overall elimination of MeHg. The Farris model has served as the foundation for subsequent PBPK models developed to meet human risk assessment goals, such as dose estimation from epidemiological data where the only information on mercury levels is a single time point determination in hair or blood samples. For example, Gearhart et al. (1995), building on the Farris model, created a multispecies-compatible model for an adult (female) with a fetal compartment. The model could produce an estimate of the daily intake of MeHg needed to yield Hg in hair at a previously established benchmark dose (BMD) level. Subsequently, PBPK models have been used to predict the variability in MeHg exposure (eg, daily intake) that explains the ranges of Hg seen in maternal hair and blood across both U.S. and Korean populations (Allen et al., 2007; Lee et al., 2017). Additional PBPK studies have targeted critical assessment of federal guidelines (eg, the USEPA MeHg reference dose [RfD]) (Allen et al., 2007; Clewell et al., 1999). These latter modeling efforts have highlighted the roles of uncertainty in model parameters and, importantly, the need to account for naturally occurring individual variability.
Here we used a PBPK model for the express purpose of refining our hypotheses on mechanisms that contribute to variation in MeHg elimination by interrogating which physiological parameters contribute the most to the variability in the overall MeHg elimination kinetics (t1/2) in humans. Building on the models of Clewell et al. (1999), Farris et al. (1993), and Gearhart et al. (1995), we use a unique dataset of input parameters of mean organ volumes and blood flow rates appropriate for a representative average man, woman, or child, to query the effects of different anthropometric and physiological factors on MeHg half-life. We verify the model with fitting to data from adult male and female subjects of our prior Methylmercury Metabolism and Elimination Status study (Caito et al., 2018). Model predictions for effects of changes in overall body mass within each sex are compared with observed experimental values. We use local and global sensitivity analyses to highlight parameters that influence MeHg t1/2 the most and in turn implicate physiological processes having the potential to moderate MeHg kinetics in people.
Materials and Methods
Model construction
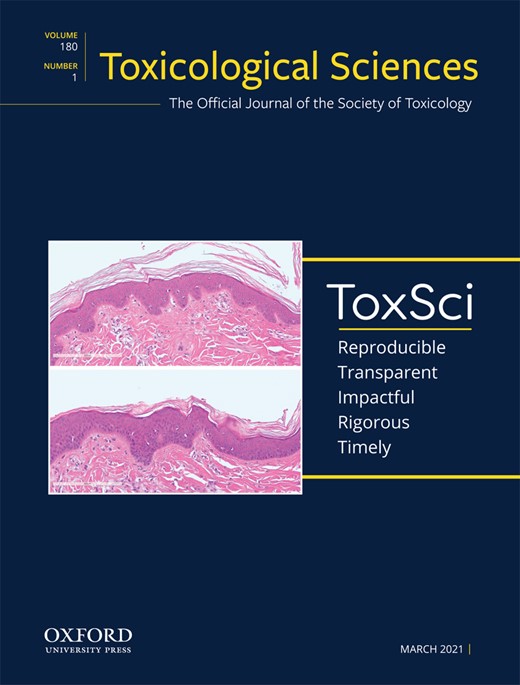
Our primary goal was to establish a PBPK model to use as a tool to evaluate the influence of individual parameters that reflect relevant physiological processes on the overall process of MeHg elimination. Establishing dose metrics for risk assessment was not a goal of this study. The model was based on prior models reported by Farris et al. (1999), Gearhart et al. (1993), and Clewell et al. (1995) and is presented in Figure 1. We intentionally limited the model to query the MeHg elimination process. MeHg elimination is the sum of its excretion (via feces and hair) and its biotransformation (de-methylation to iHg in the gut lumen and across all tissues). Therefore, we have not modeled iHg beyond its generation in the liver and the gut lumen. Urinary excretion of MeHg only becomes influential at higher doses (Clewell et al., 1999) and was excluded for simplicity. The model was parameterized with arrays of tissue volumes and flow rate values appropriate for an adult woman, man, and child (see below). We did not intend to model the pregnant woman and therefore excluded the placental/fetal compartment from the prior PBPK models (Clewell et al., 1999; Gearhart et al., 1995). The model consists of 11 compartments, which are both organ specific and lumped. Skeletal muscle (SM) volume and flow rate are separated from the lumped compartment of slowly perfused tissues (SPT). Likewise, brain, liver, kidney, and gut volume and flow rates are all separated out from the richly perfused tissue (RPT) compartment. Eight organ-specific blood flow rates and partition coefficients are applied (see Figure 1 and Table 1). An additional partition coefficient is used to describe deposition of MeHg in hair from blood. Seven kinetic parameters describe MeHg transport or biotransformation including: (1) biliary clearance, (2) absorption from the lumen to the gut tissue, (3) excretion from gut tissue to the lumen, (4) demethylation in the gut lumen, (5) demethylation in liver (representing combined demethylation across all peripheral organs), (6) transport to, and (7) out of the red blood cells (RBCs). Two kinetic parameters describe (1) fecal flow rate and (2) an excretory “flow” rate encompassing loss of MeHg to growing hair (see below). All transport and biotransformation processes are described by linear first-order kinetics. Because overall elimination kinetics of MeHg from blood are relatively slow (ie, half-life on the order of 45 days) blood distribution, including distribution to the brain, were modeled as flow limited. The exception being distribution between RBCs and plasma, which is described with 2 reciprocal transport constants. Prior models indicate MeHg biotransformation to iHg, which occurs predominantly in the gut lumen and to a lesser extent in peripheral tissues, is among the more influential elimination processes (Farris et al., 1993; Gearhart et al., 1995). Therefore, five kinetic parameters apply to MeHg disposition in the gut lumen and one to biotransformation in tissues. Enterohepatic recirculation of MeHg is modeled by transport of MeHg to the gut lumen via bile followed by absorption by gut tissue.
Model Parameters and Definitions
| Tissue volumes: Values are for mean volumes of the respective organ/compartment of child, man, woman, respectively, from Price et al. (2003, Table 15), except where noted. | ||
|---|---|---|
| Parameter | Definition | Volume (l) (Child, Man, and Woman) |
| BW | Body weight | (19.0, 73.0, 60.0)a |
| VPl | Plasma | (0.97, 3.46, 2.68) |
| VRBC | Red blood cells | (0.49, 2.36, 1.46) |
| VBr | Brain | (1.39, 1.34, 1.20) |
| VMu | Muscle | (4.90, 32.0, 21.0) |
| VRp | Richly perfused tissues | (1.00, 3.72, 2.87)b |
| VSp | Slowly perfused tissues | (0.70, 4.00, 4.00)c |
| VLv | Liver | (0.50, 1.57, 1.35) |
| VGt | Gut | (0.28, 1.23, 1.17) |
| VGL | Gutl lumen | (0.30, 0.90, 0.83) |
| VKi | Kidney | (0.09, 0.32, 0.26) |
| VFa | Fat | (3.60, 14.60, 18.0)d |
BW are values (in kg) from Valentin (2002). (Note: organ volumes are expressed as fixed values in liters. Body weight is not used for defining organ volumes based on fractional size. These average BW values are used in allometric scaling of volume, flow, and rate parameters for modeling persons of different body weights)
VRp includes tissues aside from brain, liver, kidney and gut, ie, VRp = Tot VRp − VBr − VLv − VKi − VGt. Total RPT volumes (Tot VRp) are (3.26, 8.18, 6.85 l) (Price et al., 2003, Table 15).
VSp includes tissues aside from muscle, ie, VSp = Tot VSp − VMu. Total SPT volumes (Tot VSp) are (5.60, 36.0, 25.0 l) (Price et al., 2003, Table 15).
Fat is treated separately from SPT. Fat volume values are from Valentin (2002).
Flow rates: Values are for total blood flow rates for the respective organ in child, man, woman, respectively, from Price et al. (2003, Table 15), except where noted. These values were derived from the respective organ flow rates (in l/min/ml of tissue, Price et al., 2003, Table 13) multiplied by organ volume, listed above.
| Parameter | Definition | Flow Rate (l⋅min−1) (Child, Man, and Woman) |
|---|---|---|
| QBr | Brain | (0.72, 0.68, 0.63) |
| QMu | Muscle | (0.15, 0.95, 0.63) |
| QRp | Richly perfused tissues | (0.77, 2.60, 2.21)a |
| QSp | Slowly perfused tissues | (0.02, 0.12, 0.12)b |
| QLv | Liver | (0.46, 1.32, 1.35) |
| QGt | Gut | (0.22, 0.93, 0.91) |
| QKi | Kidney | (0.33, 1.17, 0.85) |
| QFa | Fat | (0.11, 0.29, 0.54)c |
aRPT flow rate derived from average of brain, liver, and gut flow values from Price et al. (2003, Table 13; man average = 0.70 l/min/ml tissue; woman average = 0.77 l/min/ml tissue). Child flow rate assigned the same value as woman. Total flow is the product of flow rate and VRp, listed above.
bSPT flow for child, man and woman assigned same as muscle flow, which is 0.03 l/min/l tissue (Price et al., 2003, Table 13). Total flow is the product of flow rate and VSp, listed above.
cQFa calculated using flow rates of: man = 0.02 l/min/l tissue and woman = 0.03 l/min/l tissue (Price et al., 2003, Table 13). Child flow rate assigned the same value as woman. Total flow is the product of flow rate and VFa, listed above.
Plasma partition coefficients: Values are derived from blood partition coefficients from Clewell et al. (1999) and multiplied by 10 with the assumption that RBC: plasma MeHg distribution is 10:1 (see Materials and Methods section).
| Parameter | Definition | Flow Rate (l⋅min−1) (Child, Man, and Woman) |
|---|---|---|
| QBr | Brain | (0.72, 0.68, 0.63) |
| QMu | Muscle | (0.15, 0.95, 0.63) |
| QRp | Richly perfused tissues | (0.77, 2.60, 2.21)a |
| QSp | Slowly perfused tissues | (0.02, 0.12, 0.12)b |
| QLv | Liver | (0.46, 1.32, 1.35) |
| QGt | Gut | (0.22, 0.93, 0.91) |
| QKi | Kidney | (0.33, 1.17, 0.85) |
| QFa | Fat | (0.11, 0.29, 0.54)c |
aRPT flow rate derived from average of brain, liver, and gut flow values from Price et al. (2003, Table 13; man average = 0.70 l/min/ml tissue; woman average = 0.77 l/min/ml tissue). Child flow rate assigned the same value as woman. Total flow is the product of flow rate and VRp, listed above.
bSPT flow for child, man and woman assigned same as muscle flow, which is 0.03 l/min/l tissue (Price et al., 2003, Table 13). Total flow is the product of flow rate and VSp, listed above.
cQFa calculated using flow rates of: man = 0.02 l/min/l tissue and woman = 0.03 l/min/l tissue (Price et al., 2003, Table 13). Child flow rate assigned the same value as woman. Total flow is the product of flow rate and VFa, listed above.
Plasma partition coefficients: Values are derived from blood partition coefficients from Clewell et al. (1999) and multiplied by 10 with the assumption that RBC: plasma MeHg distribution is 10:1 (see Materials and Methods section).
| Parameter | Definition | Partition Coefficient |
|---|---|---|
| PBr | Brain/plasma | 30 |
| PMu | Muscle/plasma | 20a |
| PRp | Richly perfused tissues/plasma | 10 |
| PSp | Slowly perfused tissues/plasma | 20 |
| PLv | Liver/plasma | 50 |
| PGt | Gut/plasma | 10 |
| PKi | Kidney/plasma | 40 |
| PFa | Fat/plasma | 1.5 |
| PHa | Hair/plasma | 3000b |
Assigned same value as SPT.
Calculated assuming an average of hair/blood ratio of 300 and ×10 for RBC: plasma relationship (see Methods).
Kinetic parameters (k = h−1 [first order], and K = l⋅h−1).
| Parameter | Definition | Partition Coefficient |
|---|---|---|
| PBr | Brain/plasma | 30 |
| PMu | Muscle/plasma | 20a |
| PRp | Richly perfused tissues/plasma | 10 |
| PSp | Slowly perfused tissues/plasma | 20 |
| PLv | Liver/plasma | 50 |
| PGt | Gut/plasma | 10 |
| PKi | Kidney/plasma | 40 |
| PFa | Fat/plasma | 1.5 |
| PHa | Hair/plasma | 3000b |
Assigned same value as SPT.
Calculated assuming an average of hair/blood ratio of 300 and ×10 for RBC: plasma relationship (see Methods).
Kinetic parameters (k = h−1 [first order], and K = l⋅h−1).
| Parameter | Definition | Rate |
|---|---|---|
| kAbs | Intestinal absorption rate to gut tissue | 0.3 |
| kEx | Excretion rate from gut tissue to gut lumen | 0.1 |
| kGLI | Demethylation rate in intestine lumen | 0.08 |
| kLvI | Demethylation in liver | 0.001a |
| KBI | Biliary clearance (MeHg from blood to gut lumen) | 0.00035 l/h/gram tissueb |
| KFe | Fecal flow rate | (0.00208, 0.00625, 0.00500)c |
| kPlR | Transport from plasma to RBC | 3 |
| kRPl | Transport from RBC to plasma | 0.3 |
| KHa | Hair flow rate | (2.3 × 10⁻⁵, 4.0 × 10⁻⁵, 3.4 × 10⁻⁵)d |
Biotransformation across all peripheral tissues grouped in the liver.
See derivation in Materials and Methods section.
(Child, man, and woman) values from Valentin (2002)
(Child, man, and woman) see derivation of values in Methods section.
| Parameter | Definition | Rate |
|---|---|---|
| kAbs | Intestinal absorption rate to gut tissue | 0.3 |
| kEx | Excretion rate from gut tissue to gut lumen | 0.1 |
| kGLI | Demethylation rate in intestine lumen | 0.08 |
| kLvI | Demethylation in liver | 0.001a |
| KBI | Biliary clearance (MeHg from blood to gut lumen) | 0.00035 l/h/gram tissueb |
| KFe | Fecal flow rate | (0.00208, 0.00625, 0.00500)c |
| kPlR | Transport from plasma to RBC | 3 |
| kRPl | Transport from RBC to plasma | 0.3 |
| KHa | Hair flow rate | (2.3 × 10⁻⁵, 4.0 × 10⁻⁵, 3.4 × 10⁻⁵)d |
Biotransformation across all peripheral tissues grouped in the liver.
See derivation in Materials and Methods section.
(Child, man, and woman) values from Valentin (2002)
(Child, man, and woman) see derivation of values in Methods section.
Additional MeHg elimination routes include loss in growing hair and in feces (Farris et al., 1993; Gearhart et al., 1995). Loss of MeHg to hair has unique properties as an excretion route for which we have given special consideration here. Importantly, we now have the need to express concentration in hair as a function of time in the model to complement our kinetic longitudinal analyses of Hg in human subject’s hair. Prior models incorporating loss to hair are based on the rodent model of Farris et al. (1993), which posits that MeHg deposition in hair results from transport from the skin compartment, and corresponds with the movement of cells from the hair bulb to the hair shaft. It is now understood that the hair follicle has a dedicated network of vascularization (Hordinsky and Ericson, 2008), such that the follicle itself can be treated as a peripheral organ. Yet, the ultimate deposition of MeHg in the hair shaft (ie, collapsing of follicular keratinocytes) is not reversible. We have therefore treated the hair shaft as a “volume” having an excretory “flow rate” (not unlike feces). This construction allows for the model output to express concentration in hair over time, which complements our longitudinal laser-ablation ICP-MS data with single hair strands. Our derivation of parameters to describe MeHg loss in hair is detailed below. Because MeHg in the brain compartment, and its conversion to iHg in the brain, are not a focus of the present study, for simplicity, the brain is modeled as a flow limited compartment and demethylation in the brain is excluded, the latter lumped with demethylation in the liver. The model includes the ability to vary dose input amount and frequency, with the dose delivered by a zero-order rate of input to the gut lumen. In addition, where the child was modeled for weekly doses over time each parameter was allometrically scaled for growth over the dosing period. The model produces outputs of time-dependent amounts of MeHg in each compartment. In addition, cumulative amount of MeHg excreted via the hair and feces and iHg biotransformed in the gut lumen and the liver can be reported. The model executes simultaneous solution of 17 differential equations (see Supplementary Figure 1 and Mathematica code file) using the NDSolve functionality of the Mathematica programming language (Wolfram). Values for MeHg half-life are calculated directly from the model output of MeHg concentration versus time.
Model parameterization
Parameters for organ volumes and organ blood flow rates are taken predominantly from Price et al. (2003), and from the Annals of the International Commission on Radiological Protection publication 89 from 2002 (ICRP 89) (Valentin, 2002) (see Table 1). Briefly, Price et al. (2003) created a database of human physiological parameters drawing on the records of 30 000 individuals within the National Health and Nutrition Examination Survey (NHANES III). The database serves as a resource for parametrization of PBPK models evaluating interindividual variation. Within the database, parameter values for an individual are correlated with one another. In addition, the values capture interindividual variation within a population of specific sex, race and age range. Using a sampling program (Physiological Parameters for PBPK Modeling [P3M]), Price et al. (2003) created three data sets, representing a woman (25–35 years old), man (25–35 years old), and child (representing both sexes, ages 4–6), wherein each data set is comprised from 2000 records. The mean values and standard deviations of each of these data sets are reported in Table 15 of the Price et al. (2003) and the mean values only are reproduced here, reported in Table 1. It should be noted that these values are the output of regression equations that do not capture all of the variance, and that the standard deviation should not be taken as evidence of normal shapes of distribution (Price et al., 2003). Values for volume of RPT (VRp) reported in Table 1 were derived by subtracting volumes of brain, liver, kidney and gut from the value of total RPT volumes reported in Table 15 of Price et al. (2003). Similarly, the values for SPT volume (VSp) reported in Table 1 were derived by subtracting volumes of SM from the value of total SPT volumes reported in Table 15 of Price et al. (2003). RPT flow rate was derived using the average of brain, liver, and gut flow values from (Price et al., 2003, Table 13; man average = 0.70 l/min/ml tissue; woman average = 0.77 l/min/ml tissue). Child flow rate was assigned the same value as woman. Total flow for the tissue (eg, QRp) is therefore the product of these flow rates and the respective VRp. SPT flow rate for child, man and woman were assigned the same as muscle flow rate, which is 0.03 l/min/l tissue (Price et al., 2003, Table 13). Total tissue flow (QSp) is the product of this flow rate and the respective VSp. The fat flow rate was assigned the value of 0.03 l/min/l tissue (Price et al., 2003, Table 13) and total fat flow (QFa) is the product of flow rate and the respective VFa. Four parameters, average body weights (BW), fat volumes (VFa), gut lumen volumes (VGL), and fecal flow rates (KFe) were taken from ICRP 89 (Valentin, 2002).
In contrast to conventional models where volume and flow parameters are expressed as fractions of body mass and cardiac output, respectively, tissue volume and blood flow were input as individual absolute values assigned to each organ/tissue. With this construction, each parameter could be varied independently and mass balance with respect to total body mass and cardiac output is automatically accounted for. A mean value for body mass (Body Weight [BW] in kg) for man, woman, and child taken from ICRP 89 (Price et al., 2003; Valentin, 2002) was only used to perform operations of allometric scaling applied to each tissue volume, flow rate, and kinetic parameter where changes in body mass within age and sex categories were implemented. Standard allometric scaling factors were applied for organ volume ([body mass]1), organ blood flow rates ([body mass]0.75) and kinetic rates ([body mass]−0.25). The functions were performed by OrganScaleFactor, FlowScaleFactor, and RateScaleFactor command lines in the code (see Mathematica code file). Plasma and RBC compartments were separated and flow rates were assigned to plasma defined by (plasma volume/[plasma volume + RBC volume]) × the blood flow rate. MeHg exchange between plasma and RBCs compartments was defined by first-order transfer rates (kRPl, kPlR, Table 1). The model output of MeHg concentration (µg/l) in blood was calculated by sum of the MeHg amounts in RBC and plasma divided by the sum of RBC and plasma volumes.
Tissue partition coefficients were taken from prior reported values (Allen et al., 2007; Clewell et al., 1999), which were originally derived from monkey pharmacokinetic data as referenced by (Gearhart et al., 1995). Tissue partition coefficient values were kept the same for man, woman, and child. Because transport processes were described between plasma and peripheral organs, plasma partition coefficients were derived from values for blood partition coefficients. This was done using a constant multiplier of 10 based on a value of 10:1 for RBC: Plasma ratio of MeHg distribution, representative of a median of the wide range of reported values (Allen et al., 2007; Kershaw et al., 1980; Lundgren et al., 1967; Skerfving, 1974). The SM partition coefficient was assigned the same value as SPT (ie, 20 for SM: plasma), which is consistent with our recent findings for the muscle to blood ratio of MeHg in the mouse model (Rand et al., 2020).
Kinetic parameters previously reported (Allen et al., 2007; Clewell et al., 1999) were originally derived from (Gearhart et al., 1995), however, there is no reference to the primary data source or methods of deriving these values. Therefore, we revisited these values and derived kinetic parameters (except for fecal flow rate, reported by ICRP 89; Valentin, 2002) based on inference of the physiological process and by model evaluation. Because MeHg demethylation by gut flora had previously been indicated as the major elimination route, we re-evaluated processes affecting MeHg distribution to the gut lumen compartment. Conventional enterohepatic circulation involves biliary transport to the gut followed by absorption at the gut epithelium. For the latter, we estimated a first-order absorption rate (kAbs = 0.3 h−1, Table 1) based on the data of Kershaw et al. (Kershaw et al., 1980), which is consistent with a rising phase and time to peak MeHg blood concentration of 4.7 to 14 hours seen across six adults receiving a single fish meal dose of MeHg. As described for the model of Farris (Farris et al., 1993), MeHg transport via bile accounts for ∼30% of the MeHg reaching the gut lumen, indicating that as much as 70% of MeHg reaching the gut lumen is excreted from the gut tissue to the lumen. We therefore included a first-order “excretion” rate term (kEx) for MeHg transport from gut tissue to the gut lumen. Then, to establish values for transfer of MeHg to gut via bile (KBi), we executed the model, using parameters for an adult man, varying kEx and KBi while monitoring the ratio of (input from gut):(input from bile). Values of kEx and KBi that yielded a ratio of 2.3 (ie, 70%:30%) were resolved, giving KBi = 0.55 l•h−1 and kEx = 0.1 h−1 (Table 1). Then, to establish a KBi that could be adjusted to various liver sizes (eg, in adult woman and child models) the 0.55 l•h−1 value was divided by the average adult man liver volume to derive: KBi =0.55 l•h−1/1570 grams = 0.00035 l•h−1/gm tissue. To estimate MeHg demethylation rate in the gut lumen (kGLI), we varied this parameter in the model while evaluating half-life as an output, targeting the average value of t1/2 = 45 days, which resolved kGLI = 0.08 h−1. First-order transport rates between RBC and plasma where set at kPlR = 3.0 h−1 and kRPl = 0.3 h−1, to reflect the anticipated RBC: Plasma ratio of 10:1.
Hair was treated as a peripheral organ with the growing hair shaft treated as a “volume” having an excretory flow rate (KHa in L•h−1). Hair flow rate was calculated based on an average hair shaft being 80 µm in diameter (Otberg et al., 2004) and an average hair growth rate of 1.1 cm/month (Harkey, 1993; Myers and Hamilton, 1951), whereby approximately 80% of hairs are in anagen (active growth) phase (Otberg et al., 2004). Total number of hairs was estimated from values of total body surface area (19 000 cm2 for adult man, 16 000 cm2 for adult woman and 8000 cm2 for child [6 years]) (Preedy, 2012), whereby the head in adults is 9% of the body surface area and 18% of body surface area in children (O’Sullivan and Schmitz, 2007) and we assumed half of the head is covered in hair. Follicle density is reported to be 292/cm2 for the scalp and an average of 22/cm2 across the rest of the body (Otberg et al., 2004). These values yielded an estimated 519 080, 437 120, and 296 320 follicles of actively growing hair for man, woman and child, respectively. A growth rate of 1.1 cm•mo−1 of 80 µm diameter hair equates to 7.7 × 10⁻¹¹ l•h−1 per hair. In sum, this yields an estimated KHa = 4.0 × 10⁻⁵, 3.4 × 10⁻⁵ and 2.9 × 10⁻⁵ l•h−1 for an adult man, woman and child, respectively. Loss to hair can then be calculated from the concentration of MeHg in plasma times a partition coefficient of hair: plasma (PHa) times the KHa. A PHa value of 3000 was used based on reported averages of a hair: blood ratio of 300 (and ×10 for plasma) (Phelps et al., 1980; Yaginuma-Sakurai et al., 2012).
The model allowed for single and multiple dose inputs. To determine steady state levels after weekly dose regimens we modeled at least 52 doses and numerically integrated the area under the curve of the blood MeHg concentration over the final week. For multidose evaluation of the child a time dependent increase in body size was applied, with corresponding allometric scaling of volumes and rates, to account for growth, using average growth rate between 6 and 7 years of age according to (Edwards, 1978).
Model evaluation
The ability of the model to describe a realistic scenario of human MeHg elimination was evaluated by performing best fits of model simulations to the kinetic data of two subjects, a woman (Subject S38) and a man (Subject S34) from our prior MerMES study (Caito et al., 2018). The model input included the body mass of the subject and the amount of MeHg contained in each of the three weekly doses (fish meals) the subject consumed. Six kinetic parameters, kGLI (biotransformation in the gut lumen), kAbs (absorption to the gut tissue from the lumen), kEx (excretion from the gut tissue to the gut lumen), KBi (flow of MeHg from liver to gut lumen), and KHa (hair “flow” rate) and PHa (plasma: hair partition coefficient) were allowed to vary ±30% for the fitting. The model started at a nonzero concentration for MeHg which was derived by averaging the first 3 patient data points and then delivered a dose at t = 0 such that the model’s initial concentration matches the subject’s initial MeHg concentration prior to the first fish meal. Model output of MeHg in hair (assuming mg•l−1 = ppm) was reported resulting from the product of plasma: hair partition coefficient (PHa) times the plasma concentration. Model fitting was carried out using NMinimize function in Mathematica to minimize the total squared error between the model output value and the measured value at each time point. The t1/2 was then determined from the post-distribution phase of the model output curve and compared with that previously determined for the subject from the measured kinetic data (Caito et al., 2018).
Mass balance of Hg (MeHg and iHg) was assessed by performing a function of summing Hg across all compartments (and excreted Hg) at all time points and comparing this to the input amount from the doses. We found a complete conservation of the dose amount (data not shown).
Sensitivity and uncertainty analysis
The influence of parameter uncertainty on the model output was evaluated using a combination of local sensitivity analysis and a qualitative assessment of the parameter uncertainty according to the approaches of Teeguarden et al. (2005) and Yoon et al. (2009). Parameters were evaluated as having low, medium, or high sensitivity and low, medium, high uncertainty. A local sensitivity coefficient (SC) was defined as the percent change in the t1/2 resulting from a 1% change in the parameter of interest. A SC of 1 indicates a 1:1 relationship of the parameter and the t1/2. A negative SC values indicates an inverse relationship. Based on this analysis, the parameter was initially judged as having an influence on t1/2 according to the following:
| Low (L): | SC less than 0.2 |
| Medium (M): | SC between 0.2 and 0.5 |
| High (H): | SC greater than 0.5 |
| Low (L): | SC less than 0.2 |
| Medium (M): | SC between 0.2 and 0.5 |
| High (H): | SC greater than 0.5 |
| Low (L): | SC less than 0.2 |
| Medium (M): | SC between 0.2 and 0.5 |
| High (H): | SC greater than 0.5 |
| Low (L): | SC less than 0.2 |
| Medium (M): | SC between 0.2 and 0.5 |
| High (H): | SC greater than 0.5 |
Values of SC below 0.2 are not reported. The uncertainty of parameters exhibiting medium or high SC was then assessed qualitatively with respect to the following criteria:
| Low (L): | Data were directly available for the parameter or the value was optimized using the relevant tissue data for MeHg. |
| Medium (M): | Information on kinetics is available and/or the underlying biological processes are relevant for the parameter with respect to MeHg. |
| High (H): | Data were not directly available for MeHg. Reasonable assumptions can be made based on the information on other essential elements or related biological processes relevant for the parameter description. |
RESULTS
Model Evaluation
Our model construction, being based on an average man, woman, and child, utilized absolute values for organ volumes and flow rates (vs fractions of body mass and fraction of cardiac output, respectively), thus a mass balance between total body weight and sum of individual organ weights is not required for the model to execute appropriately. Nonetheless, we inspected the mass balance and total flow rate of our parametrization to qualitatively assess the legitimacy of their values. The sum of all organ/tissue volumes, including the gut lumen, for child, man, and woman is 14.2, 65.5, and 54.8 and liters (Table 1). This compares with the average body weights of 19, 73, 60 kg, respectively, used in the model. With a simple assumption of 1 l = 1 kg, the difference can be roughly accounted for by the skeleton mass, which is 2.4, 10.5, and 7.8 kg, respectively (Valentin, 2002), and is not included among the organs in the model. Flow rates summed across organs is 3.0, 7.8, and 7.2 l•min−1, for child, man, and woman (Table 1). Although these values are somewhat higher than the average cardiac output reported for adults in ICRP 89 (3.4, 6.5, 5.9 l•min−1; Valentin, 2002) they are within the range of adult cardiac output reported by Price et al. (man: 5.5–8.0, woman: 4.7–7.4 l•min−1; Price et al., 2003, Table 15).
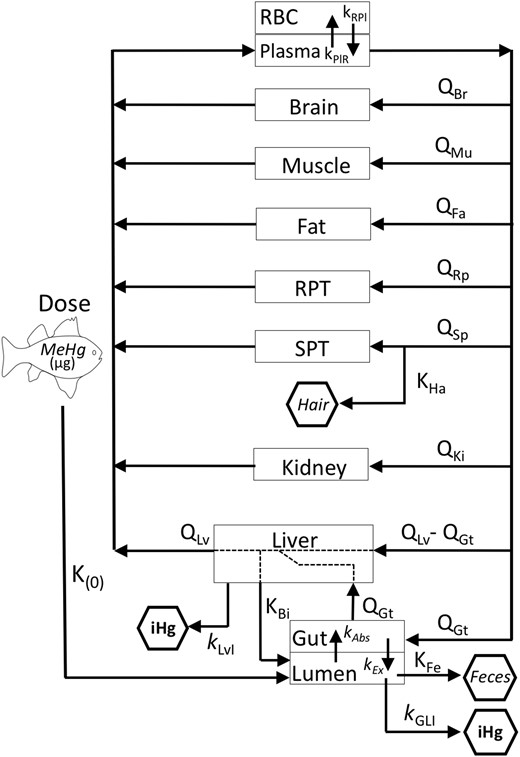
We next evaluated how well a model simulation could fit the data from the MeHg dosing and elimination profile of human subjects that we have determined previously (Caito et al., 2018). The Hg profile measured longitudinally in the hair of a 72.6-kg adult woman who consumed 3 meals of tuna, 1 week apart, each containing an average of 131 µg MeHg is seen in Figure 2A. For this profile, hair Hg levels were determined by a laser ablation ICP-MS method that yielded Hg determinations in part per million (ppm) at approximately 1-day intervals (see Caito et al., 2018). By visual inspection, a very good simulation of the data was achieved where the best fit resulted in elimination rate of t1/2 = 40.1 days. This value compares with the experimentally determined value of t1/2 = 45 days for this subject (Subject S38 in Caito et al., 2018). Similarly, a very good simulation of the data measured in the hair of a 78.9-kg adult man who consumed 3 meals of tuna, 1 week apart, each containing an average of 272 µg MeHg is seen in Figure 2B. The best fit resulted in elimination rate of t1/2 = 51.8 days. This latter value compares with the experimentally determined value of t1/2 = 44 days for this subject (Caito et al., 2018). Of note, this subject was previously reported to have received antibiotic in the latter portion of the elimination period (indicated by arrow in Figure 2B). The hair Hg values are seen to deviate from the model output consistent with a slowing of the MeHg elimination in the subject.
Measured and simulated values for the time course of MeHg in hair after fish meals. Data points show the longitudinal profile of total Hg measured in a single hair of a female (S38, A) and male (S34, B) subject who consumed 3 fish meals at 1 week intervals, as previously reported in Caito et al. (2018). Solid line indicates model simulation producing the best fit to the data. Model inputs used the respective body mass and MeHg dose amounts for each subject (72.6 kg female, 131 µg/dose; 78.9 kg male, 272 µg/dose). Arrow in (B) indicates time point of antibiotic administration that occurred in subject S34. (See text for discussion).
Model Outputs for Man, Woman, and Child: Single Dose Half-Life Determinations
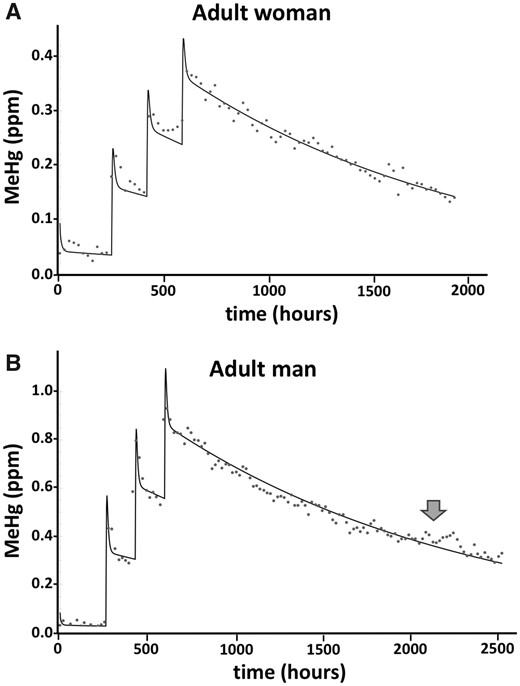
As a first approach to examine parameters that influence variability in MeHg metabolism and elimination, we evaluated fundamental anthropometric differences using parameters appropriate for man, woman, and child (Table 1). For this comparison, plasma partition coefficients and the 6 kinetic parameters kGLI, kLvI, kAbs, kEx, kPlR, and kRPl were held constant. Although flow rates and tissue volumes varied in accordance with the sex and age designation (Table 1). Figure 3 shows the model output profile of blood MeHg concentration (µg/l) subsequent to a single oral MeHg dose. A dose amount of 0.7 µg/kg body weight/week was used to represent the oral reference dose (RfD) according to federal guidelines of the USEPA (0.1 µg/kg body weight/day; EPA, 2001). Because the mean body mass values for man, woman, and child are 73, 60, and 19 kg, respectively (Table 1), MeHg doses were 51.1, 42.0, and 13.3 µg, respectively. Peak blood MeHg levels were reached between 8 and 10 h and were 0.43, 0.50, and to 0.46 µg/l for man, woman, and child, respectively. After a distribution phase that was complete in approximately 50 h, the decay of MeHg assumed an apparent first-order process with elimination rates equivalent to t1/2 = 46.9, 38.9, and 31.5 days for man, woman, and child, respectively (Figure 3, inset). After 1 week, levels of MeHg in blood of man, woman, and child are 0.24, 0.28, and 0.30 µg/l, respectively.
Time course of MeHg in blood after a single dose. Model simulation of blood MeHg levels resulting from a single dose equivalent the USEPA reference dose (0.7 µg/kg BW/week), administered to a man (blue), woman (red), and child (green). Model was run using parameter values in Table 1. Half-life (t1/2) values for each condition are in the inset.
Model Outputs for Man, Woman, and Child: Multidose, Steady-State Estimates
By applying multiple doses at 0.7 µg/kg body weight/week, the resulting steady-state level of MeHg in blood after 1 year was 2.6, 2.6, and 2.3 µg/l for man, woman, and child, respectively (Figure 4). The 95% of steady state was reached in 203, 171, and 136 days, for man, woman and child, respectively.
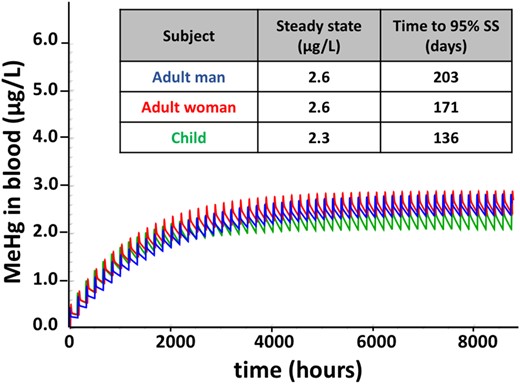
Time course of MeHg in blood after repeated doses. Model simulation of blood MeHg levels resulting from repeated weekly doses for 1 year, with the unit dose equivalent to the EPA reference dose (0.7 µg/kg BW/week), administered to a man (blue), woman (red), and child (green). Model was run using parameter values in Table 1. Steady-state blood concentrations and time to 95% steady state (SS) are indicated in the inset.
Evaluation of Elimination Routes
The cumulative amount of Hg in each of the 4 elimination routes, biotransformation in gut lumen (KGLi), MeHg excretion via hair, biotransformation in the liver (KLvi), and MeHg excretion in feces, over a 50-day period after a single dose is seen in Figure 5. MeHg elimination was seen to predominantly occur via biotransformation in the gut lumen. By day 50 (1200 h), 46% and 51% of the dose in the adult man and woman, respectively, was removed via biotransformation in the gut lumen, representing 73% of the total eliminated MeHg in each case (Figs. 5A and 5B). In man and woman, 8 to 9% of the dose is excreted as MeHg via hair, representing 13% of total excreted Hg. In contrast, 18% of the dose is excreted via hair in the child, equaling 24% of total eliminated MeHg. Biotransformation in liver accounts for 5–7% of the dose, whereas 4% of the dose leaves as MeHg directly excreted via feces across woman, man, and child (Figure 5). Of particular note, slightly more than 20% of the dose is eliminated via gut biotransformation in the first 10 h.
![Time course of MeHg elimination via biotransformation and excretion routes. The cumulative amount of MeHg eliminated (as MeHg [hair and feces] or biotransformed iHg [gut lumen and liver]) is plotted in terms of the fraction of the dose versus time. The fraction of dose and the percent of total eliminated MeHg (in parentheses) at 50 days are indicated to the right. Model was run using parameter values in Table 1.](https://oup.silverchair-cdn.com/oup/backfile/Content_public/Journal/toxsci/180/1/10.1093_toxsci_kfaa192/1/m_kfaa192f5.jpeg?Expires=1716320930&Signature=W3DPPbmsb3P1g~o4Zq23koDLUfCSkvy9jWZtaBs0Ch08OMXcLjINVXWQ9eapMNJ20XQO27D6qwnda4wxq0NHnHMKNEMXYHpH7~NeYWVZujVHh3uGl9MggyRurep7I~-Ub-BZ1s0cgFVzLdcVEeIK2cITnQxbU6r9~hZE2benih0r3ivuyXhQ6M8qR-xHx-kCJ-AJbavImR-lKF5x5E2jrsVOZgFOjBRLcK8R5A1rAjSLI7YY6UFLmShhsV~3wDAeA-hTXmITIbo6cQaX2BjAiIybO0PMo6CulMZnbaUrpiQgN6l6lL4tIFz09THtNQJIugXRU~E4JaqR3SUSZHIDRw__&Key-Pair-Id=APKAIE5G5CRDK6RD3PGA)
Time course of MeHg elimination via biotransformation and excretion routes. The cumulative amount of MeHg eliminated (as MeHg [hair and feces] or biotransformed iHg [gut lumen and liver]) is plotted in terms of the fraction of the dose versus time. The fraction of dose and the percent of total eliminated MeHg (in parentheses) at 50 days are indicated to the right. Model was run using parameter values in Table 1.
Relationship of MeHg Elimination and Body Mass
The effect of body mass on MeHg t1/2 was investigated with model simulations and compared with the measured values from 14 male and 23 female subjects (Caito et al., 2018). Body mass values corresponding to each of the human subjects was input to the model and the resulting t1/2 was determined. The model output demonstrates an increase in t1/2 with increased body mass for both adult man and woman (Figure 6, filled circles). Linear regression yields a line with a positive slope (y = 0.149X + 36.5; R square = 0.991 and y = 0.118X + 30.7; R square = 0.993, for adult man and adult woman, respectively). For adult man and woman, a doubling in body mass from 55 to 110 kg results in an approximately 20% increase in t1/2 as predicted by the model. An association of body mass and t1/2 is not apparent from the values determined experimentally from human subjects (Figure 6, open circles, and in Caito et al., 2018). Linear regression of the measured t1/2 values shows that the slope is not significantly different from zero for both man and woman (data not shown). It is of note that among the women, where body mass was not normally distributed and clustered between 55 and 75 kg, 15 of the 23 individuals showed t1/2 greater than predicted from the model simulation.
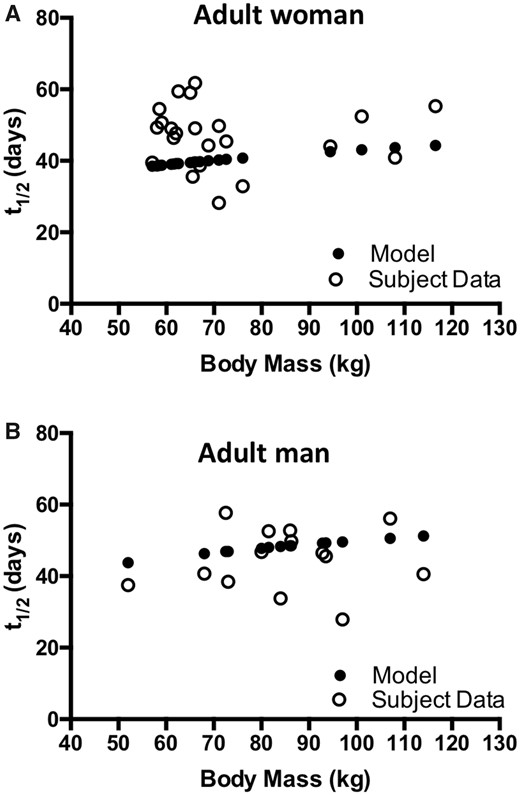
Relationship of body mass and MeHg elimination kinetics. MeHg elimination rate, represented as half-life (t1/2), corresponding to body mass for 23 women (A, open circles) and 14 men (B, open circles) as reported by Caito et al. (2018) is plotted together with model-simulated values for t1/2 for the corresponding body mass of each subject (filled circles).
Sensitivity and Uncertainty Analysis of Model Parameters
The results of local sensitivity and uncertainty analysis are presented in Table 2. The most sensitive parameters are the volume and partition coefficient for SM. The uncertainty for both of these parameters was low, because SM volume values are obtained with some certainty from Price et al. (2003) and the muscle partition coefficient can be ascribed the same value as SPT with some certainty. Furthermore, recent experimental data from our own studies in mice has yielded muscle to blood MeHg ratio between 2:1 and 3:1 at steady state (Rand et al., 2020), consistent with the plasma partition coefficient (PMu = 20) ascribed here. The next most sensitive parameters are the absorption and excretion transport rates between gut lumen and gut tissue (with inverse relationship to each other), as well as MeHg biotransformation in the gut. The high sensitivity of the absorption rate carries medium uncertainty, because kinetic data are available from both rodent and human studies that support the estimated value used (Kershaw et al., 1980; Norseth and Clarkson, 1971). Excretion of MeHg from gut tissue to gut lumen has high uncertainty, as this is inferred indirectly from rodent studies where bile duct ligation was performed to eliminate the hepatic contribution to the gut lumen (Farris et al., 1993). Biotransformation rate in the gut lumen has medium uncertainty because biotransformation by cecal and fecal contents has been demonstrated in vitro (Rowland et al., 1978). Furthermore, in vitro assays of MeHg demethylating bacteria demonstrate an approximate half-time of <12 h (Chien et al., 2010), consistent with a first-order rate of 0.08 h−1 ascribed here.
Model Sensitivity and Uncertainty Designations
| Parameter | Sensitivity Coefficient (SC) | Sensitivity | Uncertainty |
|---|---|---|---|
| Muscle volume (VMu) | 0.57 | H | L |
| Muscle partition coeff. (PMu) | 0.57 | H | L |
| Gut tissue volume (VGt) | −0.46 | M | L |
| Gut tissue partition coeff. (PGt) | −0.46 | M | L |
| Transport from gut tissues to lumen (kEx) | −0.48 | M | H |
| Transport from lumen to gut tissue(kAbs) | 0.52 | H | M |
| Rate of biotrans. in gut lumen (kGLI) | −0.49 | M | M |
| Transfer to gut lumen via bile (KBi) | −0.2 | M | M |
We next evaluated the relative influence of each parameter on t1/2 with a global sensitivity analysis approach. Among the 37 parameters, 8 showed Si values with a significant effect on t1/2 (Figure 7, Supplementary Table 1). The most sensitive kinetic parameter was the volume of the gut tissue (VGt). This was followed by biotransformation in the gut lumen (kGLI) and transport out of and into the gut lumen (kAbs and kEx, respectively). The volume and partition coefficient of SM (VMu and PMu, respectively) also gave significant Si values. The volume of SPT (VSp) also showed sensitivity that reached significance.
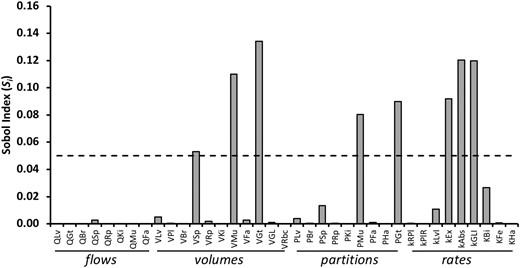
Global sensitivity analysis of model parameters. The Sobol index (Si) for first-order global sensitivity analysis for each of 37 parameters of the PBPK is shown. Dashed line indicates the cut off level of significance (0.05). (See text for discussion and Supplementary Table 1 for Si and confidence values).
DISCUSSION
We have used PBPK modeling to investigate factors that potentially influence variability in MeHg metabolism and elimination kinetics in the human body. Our aim in this study is to support our ongoing efforts to elucidate physiological, cellular, and molecular mechanisms that regulate metabolism and excretion of Hg stemming from MeHg exposure. As such, our study is not intended to meet goals of risk assessment directly. Whereby kinetic principles dictate that the elimination rate, or t1/2, directly influences the steady state concentration of MeHg in the body with repeated exposures (eg, weekly fish consumption), our goal is to understand the major mechanisms that influence MeHg t1/2 as an inroad to possible intervention strategies to reduce MeHg body burden.
The present model was able to simulate the data from two individuals from our prior human MerMES study very closely. These fits were achieved with changes in a limited set of parameters that were allowed to vary within ±30% of the input values. The goodness of fit of these data indicated the fixed values of the remaining parameters are reasonable and the model is adequate for simulations to investigate effects of parameter variation on half-life kinetics.
The model demonstrates faster elimination kinetics in the adult woman and child compared with the adult man, with the child potentially having much faster MeHg elimination (t1/2 = 31.5 days vs 38.9 days for woman and 46.9 days for man). This difference between man, woman, and child predicts that steady-state body burden, as reflected by blood MeHg, would differ with routine MeHg dosage (eg, weekly fish consumption). Yet, with multiple doses over the course of a year the model simulation shows that the adult man and woman, receiving the same proportional unit dose (0.7 µg/kg bw/week), have an equal blood concentration of MeHg. Although this deviates from what would be predicted, this is likely due to the influence of the SM having a larger proportional volume in men compared with women, resulting in partitioning of proportionally more MeHg to muscle from the blood. In contrast, the model shows that the child receiving the same proportional unit dose exhibit approximately 12% lower blood MeHg levels at steady state compared with woman and man. This prediction begs the question of whether or not MeHg kinetics are indeed faster in children and highlights an urgent research need, as there are currently no controlled studies that evaluate MeHg kinetics in children.
Our model predicts that biotransformation in the gut lumen is the major elimination route with 46–51% of the MeHg dose (73% of the total eliminated MeHg) eliminated over a 50-day period. This rate is consistent with prior models and experimental data from rodents and humans (Farris et al., 1993; Gearhart et al., 1995; Smith et al., 1994), where a majority of the dose is excreted as iHg via feces. Hair represents the next most abundant excretion route where, in adults, 13% of the total excreted Hg leaves via this route. This value is also consistent with what has been observed in rodent experiments (Farris et al., 1993). However, a notable difference is seen in the child, where 24% of total excreted Hg leaves as MeHg excreted via hair. This increased elimination via hair in the child occurs while rates of elimination via gut and liver biotransformation and fecal excretion are similar to that in adults. This higher excretion rate via hair in the child tracks with the fact that head surface area in proportion to the body for the child is nearly twice that of adults (O’Sullivan and Schmitz, 2007). It also follows that hair excretion is the likely driver of the faster overall elimination rate (lower t1/2) seen in children. Excretion of 5–7% of the dose via biotransformation to iHg in liver and 4% via excretion directly via feces is in keeping with values observed in human studies (AAberg et al., 1969; Smith et al., 1994). Also notable is the rapid elimination of MeHg predicted to occur in the first 10 h due to biotransformation in the gut lumen, removing over 20% of the dose. This is in contrast to the common notion derived from rodent studies that show as much as 95% or more of the MeHg dose is absorbed (Farris et al., 1993; Norseth and Clarkson, 1971). This effect in our model stems from the residence time of MeHg in the gut lumen immediately after the dose, which is directly affected by the kAbs and kEx terms. These 2 parameters carry medium to high uncertainty. A doubling of both of these rates simultaneously in the model results in just 10% of the dose being biotransformed in the gut lumen the first 10 h, with a marginal effect on t1/2 (data not shown). This observation emphasizes the importance more empirical experiments to understand transport kinetics of MeHg between the gut lumen and the gut epithelium.
Of note, the elimination rate currently used in calculating the USEPA reference dose (RfD; 0.014 day−1; t1/2 = 49.5 days) is based on an average value derived from studies that have predominantly measured MeHg kinetics in adult men (EPA, 2001; Rand and Caito, 2019). Our model reports that fish consumption adhering to the EPA RfD (0.7 µg/kg BW/week; EPA, 2001) would achieve near-steady-state level of ∼2.6 µg/l in blood in about 171–203 days, for man and woman, whereas a child would attain ∼2.3 µg/l in blood in about 136 days. These predicted blood values are half of the BMD amount (5.8 µg/l) upon which the EPA RfD is formulated (EPA, 2001). Although our intent in this study is not to generate a model to gauge efficacy of current risk assessment guidelines, our results are nonetheless consistent with prior MeHg PBPK models that show attaining the BMD level in blood would require a dose amount 2–3 times higher than the RfD (ie, 1.4–2.1 µg/Kg BW/week) (Clewell et al., 1999; Gearhart et al., 1995).
Our model predicts that an increase in body mass yields a slight increase in t1/2 (slower elimination). This relationship was not immediately apparent in our data from human subjects. Notably, in females the model appeared to produce shorter t1/2 values than was generally observed across the 23 women evaluated. These findings point out potential insufficiencies in our model with respect to parameters that are more difficult to establish. One obvious determinant that influences the relationship of body mass to elimination rate is the amount of fat in proportion to the lean body mass. Fat has little influence on the elimination rate, while contributing greatly to body mass. Our model currently uses fixed values for tissue volumes as initial inputs, then scales organ volumes in direct proportion to changes in body mass. It follows that in the instance where increased body mass is due to fat the t1/2 is not predicted to increase. Accordingly, where fat is in higher than average proportion, the t1/2 would be predicted to be less than predicted by body mass alone with our model. This property likely contributes to the difference between the modeled and measured values of t1/2 of women in the 55–80 kg weight range. Nonetheless, the number of human subjects evaluated so far in our MerMES studies is relatively small. It is anticipated that improvements in our modeling will benefit from a more extensive data set from a larger cohort of people and a better assessment of lean body mass relative to total body mass.
Global sensitivity analysis showed 8 of 37 parameters having significant Si values. Four of these eight parameters share the property of influencing the amount MeHg, or its biotransformation, in the lumen of the gut. This is consistent with an overall mechanism whereby biotransformation and excretion of MeHg as iHg via feces is the primary route of MeHg elimination (reviewed in Rand and Caito, 2019), and accordingly, the most influential mechanism to reduce MeHg body burden. Several rodent studies point to biotransformation (de-methylation) of MeHg by gut microbes as a rate limiting step in elimination (Rowland et al., 1977, 1984). Although less well characterized in humans, our MerMES results support this mechanism by demonstrating a slowing of MeHg elimination in subjects upon taking antibiotics (Caito et al., 2018) (Figure 2B). It follows that a potential strategy for moderating MeHg body burden is to alter the gut microbiome composition, for example, via dietary supplementation with pro- or prebiotics. Available studies are beginning to show evidence that this strategy works (Bisanz et al., 2014; Duan et al., 2020), and we are currently addressing this in a controlled manner with our ongoing MerMES studies. A simple interpretation of this model would suggest that elevated levels of intestinal bacterial species capable of de-methylating MeHg would enhance MeHg elimination and reduce body burden. However, gut microbiome-host interactions are extremely complex. It is also likely that microbial metabolites could induce alterations in the gut epithelial absorption and excretion (Duan et al., 2020), parameters that our model indicates as having a strong influence on the MeHg kinetics.
Unexpectedly, parameters for SM volume and partitioning from blood to muscle (VMu and PMu, respectively) demonstrated a high SC and a high first-order Si value in sensitivity analyses. This finding indicates that SM has a significant influence on elimination rate and thus can impact MeHg body burden. Because SM constitutes 30–40% of the body mass (Brown et al., 1997), and considering a muscle: blood partitioning of up to 3:1 (Rand et al., 2020), the muscle compartment is a major determinant of the volume of distribution of MeHg. Sensitivity of VMu and PMu parameters is therefore consistent with fundamental toxicokinetic principles, whereby the half-life is directly influenced by the volume of distribution (Vd); ; (Cl = clearance). This result suggests that determinations of lean body mass could be clinically informative for predicting MeHg elimination kinetics and body burden. In addition, this finding highlights the opportunity of exploring effects of muscle fitness and exercise on MeHg kinetics. For example, where exercise could reduce the partitioning of MeHg to muscle, there may be a benefit of higher rates of MeHg elimination. Altogether, parameter sensitivity analyses highlight several physiological entry points by which MeHg metabolism and elimination may be modulated, eg, by altering gut microbiota for more efficient biotransformation and possibly by conditioning of SM.
There are several limitations to our model and this study. First, there are limited data in humans upon which to base the parameter values of kGLI, kAbs, and kEx used in building this model, all of which demonstrate a medium to high local SC, uncertainty and a high global sensitivity Si value. In addition, some influential physiological processes, such as elimination via hair, are only rudimentarily modeled here. The substantial variability in properties such as hair growth rates and follicle density deserve more in-depth consideration. Similarly, sloughing off of intestinal epithelia, which is known to harbor MeHg/iHg, is an additional route of excretion which is not parameterized here. Future model refinement will be necessary to accommodate these factors and assess the importance of their contribution to overall MeHg elimination kinetics.
In summary, using PBPK modeling we affirm that the rate of MeHg biotransformation to iHg in the gut lumen is predicted to have the greatest overall impact on MeHg elimination in humans. MeHg excretion via hair is a significant elimination route that potentially impacts children more than adults. Finally, MeHg elimination kinetics are significantly influenced by intrinsic properties of the volume of SM and gut tissue as well as the ability of these tissues to partition MeHg.
SUPPLEMENTARY DATA
Supplementary data are available at Toxicological Sciences online.
ACKNOWLEDGMENTS
We wish to thank Harvey Clewell for valuable feedback during development of this model. We thank members of the Rand lab for meaningful discussion.
FUNDING
National Institute of Environmental Health Sciences (R21ES024859 to PI: M.D.R, R01ES025721 to PI: M.D.R., P30ES001247 to co-I: M.D.R.).
DECLARATION OF CONFLICTING INTERESTS
The authors declared no potential conflicts of interest with respect to the research, authorship, and/or publication of this article.
REFERENCES
EPA. (
SALib. (

Comments