


Abstract
Periodic vitamin A supplementation is a major intervention to reduce morbidity, mortality, and blindness among children in developing countries. The goal was to characterize the coverage of the Ethiopia national vitamin A program among preschool children and to identify risk factors for not receiving vitamin A. In the Ethiopia Demographic and Health Survey of 2005, among 4762 preschool children, aged 12–59 months, 46.8% received a vitamin A capsule within the last 6 months. There were no significant differences in stunting, underweight, or wasting between children who did or did not receive a vitamin A capsule. In multivariate logistic regression analyses, maternal education of ≥10 years [odds ratio (OR) 1.90, 95% confidence interval (CI) 1.23–2.92], 7–9 years (OR 2.47, 95% CI 1.67–3.65), 4–6 years (OR 1.56, 95% CI 1.18–2.07), and 1–3 years (OR 1.11, 95% CI 0.90–1.37), and paternal education of ≥10 years (OR 1.61, 95% CI 1.14–2.29), 7–9 years (OR 1.24, 95% CI 0.94–1.64), 4–6 years (OR 1.26, 95% CI 1.03–1.56), and 1–3 years (OR 1.29, 95% CI 1.05–1.50) were associated with the child receiving a vitamin A capsule compared with no years of formal parental education. Expanded coverage of the national vitamin A capsule program may help protect children from nutritional blindness and to help reach Millennium goals for reducing under-five child mortality in Ethiopia.
Vitamin A deficiency is a leading cause of blindness, morbidity, and mortality among preschool children in developing countries and has long been recognized as a major public health problem in Ethiopia [1–4]. Worldwide, vitamin A deficiency affects an estimated 140 million children [5]. Vitamin A is essential for normal growth, maintenance of mucosal surfaces, reproduction, immunity, and vision [6]. Periodic high-dose vitamin A supplementation programs have been established over the last three decades in many developing countries in order to increase child survival and decrease the incidence of pediatric blindness. Vitamin A supplementation is a highly cost-effective intervention for child health [7] and reduces all-cause mortality among preschool children by nearly one-quarter [8]. The Millennium Development Goals include reducing child mortality by two-thirds between 1990 and 2015 [7, 9], and effective coverage of periodic high-dose vitamin A supplementation programs will be critical in reaching this goal. The specific aims of this study were to characterize the coverage of the national vitamin A capsule program in Ethiopia and to identify factors associated with receipt or non-receipt of a vitamin A capsule within the last 6 months. In order to address these aims, we examined population-based, demographic and health survey data from Ethiopia.
Methods
The study subjects were preschool children and their families who participated in the 2005 Ethiopia Demographic and Health Survey (EDHS), a nationally representative survey that was part of the worldwide Demographic and Health Surveys (DHS) project [10]. The primary objective of the 2005 EDHS was to provide up-to-date information for policy makers, researchers, and program managers that would allow guidance for the monitoring and evaluation of health programs [10]. The 2005 EDHS sampled 535 clusters in 11 geographic areas (9 regions and 2 city administrations): Tigray, Affar, Amhara, Oromiya, Somali, Benishangul-Gumuz, Southern Nations, Nationalities and Peoples (SNNP), Gambela, Harari, Addis Ababa, and Dire Dawa. Households were selected by stratified, cluster sampling selected from enumeration areas from the 1994 Population and Housing census sample frame. Data were collected by a total of 30 data collection teams, each comprised of four female interviewers, two male interviewers, one female editor, and a male team supervisor. Anthropometric measurements were conducted on children by the data collection teams. Data collection was monitored through regular field visits by senior staff and members of the steering committee. Data from questionnaires was entered twice by two separate data entry clerks, with consistency checks followed by manual corrections of data entry errors, and then secondary editing programming to correct any final inconsistencies. The response rate of households to the interviews was 99%.
The study protocol complied with the principles enunciated in the Helsinki Declaration [11]. The field teams were instructed to explain the purpose of the survey to the mother or father, and data collection proceeded only after informed consent. Participation was voluntary, no remuneration was provided to subjects, and all subjects were free to withdraw at any stage of the interview. The EDHS was conducted under the auspices of the Ministry of Health and implemented by the then Population and Housing Census Commission Office (now merged with the Central Statistical Agency). Data from the 2005 EDHS is in the public domain and was obtained through Measure DHS [12]. The plan for secondary data analysis was approved by the Institutional Review Board of the Johns Hopkins University School of Medicine.
The youngest child, aged 12–59 months, in the household was used as the index of a child receiving a vitamin A capsule (i.e., households were not counted more than once). The World Health Organization Child Growth Standards were used as the reference growth curves for child height-for-age [13]. Maternal age was divided into quartiles. Maternal and paternal education was categorized as 0, 1–3 (first half of primary), 4–6 (second half of primary), 7–9 (junior high), and ≥10 years (high school or greater). Weighting was used to adjust for urban as well as rural population size, respectively, and all results reported in the tables are weighted. Weekly per capita household expenditure was used as the main indicator of socioeconomic status. The number of children in the family was used as an indicator of crowding. Chi-square tests were used to compare categorical variables between groups. Multivariate logistic regression models were used to examine the relationship between maternal and paternal education and other variables and receipt of a vitamin A capsule in the last 6 months. Variables were included in the multivariate models if significant in univariate analyses. p < 0.05 was considered significant. Data analyses were conducted using SAS Survey (SAS Institute, Cary, NC) [14].
Results
From 27 April through 30 August 2005, interview data were collected from 13 721 households. There were 7797 children aged 12–59 months in the survey, of whom 4762 were considered the youngest in the household and were represented in the analyses of vitamin A capsule receipt. Of 4762 children, 2229 (46.8%) received a vitamin A capsule within the last 6 months. The demographic, anthropometric, and health characteristics of children and their families by vitamin A capsule receipt are shown in Table 1. Among families where children received a vitamin A capsule, the level of maternal and paternal education was higher. There were no significant differences between children who did and did not receive vitamin A by child age, sex, anthropometrics, or disease morbidity. The proportion of children who received a vitamin A capsule within the last 6 months is shown by location in Fig 1. Affar and Benishangul-Gumuz had the lowest coverage, and coverage was highest in Tigray, SNNP, and Addis Ababa. In a multivariate logistic regression model, higher levels of maternal and paternal education were associated with the child receiving a vitamin A capsule in the last 6 months (Table 2).
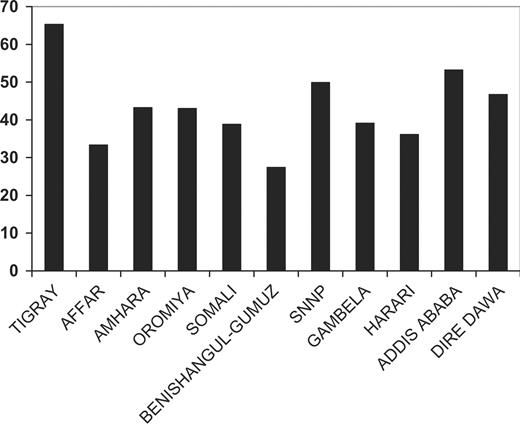
Proportion of children, aged 12–59, who received a vitamin A capsule within the last 6 months, by region in Ethiopia.
Characteristics of children and families by vitamin A capsule receipt in Ethiopia
| Characteristic | Did not receive vitamin A | Received vitamin A | p | ||
|---|---|---|---|---|---|
| n | % | n | % | ||
| Child age (months) | |||||
| 12–23 | 183 | 7.2 | 162 | 7.3 | 0.81 |
| 24–35 | 855 | 34.9 | 751 | 33.7 | |
| 36–47 | 876 | 34.5 | 777 | 34.8 | |
| 48–59 | 589 | 23.2 | 539 | 24.2 | |
| Child sex | |||||
| Female | 1261 | 49.8 | 1125 | 50.5 | 0.64 |
| Male | 1272 | 50.2 | 1104 | 49.5 | |
| Maternal age (years) | |||||
| ≤22 | 405 | 16.1 | 326 | 14.7 | 0.16 |
| 23–26 | 564 | 22.4 | 456 | 20.6 | |
| 27–30 | 600 | 23.8 | 568 | 25.6 | |
| 31+ | 950 | 37.7 | 866 | 39.1 | |
| Maternal education (years) | |||||
| 0 | 2045 | 81.4 | 1577 | 71.3 | <0.0001 |
| 1–3 | 230 | 9.2 | 214 | 9.7 | |
| 4–6 | 131 | 5.2 | 176 | 8.0 | |
| 7–9 | 54 | 2.1 | 127 | 5.7 | |
| ≥10 | 53 | 2.1 | 118 | 5.3 | |
| Paternal education (years) | |||||
| 0 | 1634 | 65.1 | 1201 | 54.6 | <0.0001 |
| 1–3 | 272 | 10.8 | 264 | 12.0 | |
| 4–6 | 318 | 12.7 | 321 | 14.6 | |
| 7–9 | 164 | 6.5 | 182 | 8.3 | |
| ≥10 | 123 | 4.9 | 232 | 10.5 | |
| Number of children in household | |||||
| 1 | 1456 | 57.5 | 1399 | 62.8 | 0.001 |
| 2 | 1011 | 39.9 | 783 | 35.1 | |
| 3+ | 66 | 2.6 | 47 | 2.1 | |
| Stunting | 728 | 60.0 | 653 | 57.0 | 0.15 |
| Severe stunting | 445 | 36.7 | 398 | 34.8 | 0.32 |
| Underweight | 484 | 39.7 | 434 | 37.8 | 0.36 |
| Severe underweight | 188 | 15.4 | 173 | 15.1 | 0.81 |
| Wasting | 144 | 12.1 | 127 | 11.2 | 0.55 |
| Severe wasting | 64 | 5.4 | 59 | 5.2 | 0.86 |
| Current diarrhea | 107 | 4.3 | 97 | 4.4 | 0.87 |
| Diarrhea last 7 days | 363 | 14.4 | 337 | 15.2 | 0.53 |
Multivariate logistic regression analysis of factors associated with child receipt of a vitamin A capsule in the last month in Ethiopia
| Characteristic | OR | 95% CI | p |
|---|---|---|---|
| Maternal age | |||
| ≤22 | 1.00 | – | – |
| 23–26 | 0.99 | 0.82–1.21 | 0.97 |
| 27–30 | 1.19 | 0.97–1.45 | 0.09 |
| 31+ | 1.22 | 1.01–1.46 | 0.035 |
| Maternal education (years) | |||
| 0 | 1.00 | – | – |
| 1–3 | 1.11 | 0.90–1.37 | 0.34 |
| 4–6 | 1.56 | 1.19–2.07 | 0.0017 |
| 7–9 | 2.47 | 1.67–3.65 | <0.0001 |
| ≥10 | 1.90 | 1.23–2.92 | 0.0037 |
| Paternal education (years) | |||
| 0 | 1.00 | – | – |
| 1–3 | 1.29 | 1.05–1.59 | 0.014 |
| 4–6 | 1.26 | 1.03–1.56 | 0.028 |
| 7–9 | 1.24 | 0.94–1.64 | 0.13 |
| ≥10 | 1.61 | 1.14–2.29 | 0.0075 |
Discussion
This study shows that the national vitamin A supplementation program in Ethiopia did not reach over one-half of preschool children during the time of the survey in 2005. Ideally, the vitamin A supplementation programs should reach at least 85% of preschool children according to the World Bank [15]. The goal of the Ministry of Health of Ethiopia in their 5-year plan initiated in 2005 is to reduce under-five child mortality from 140 to 85 per 1000 population [10], and vitamin A supplementation is an important part of the child survival strategy. In Ethiopia, vitamin A supplementation has been mainly administered through the Enhanced Outreach Strategy (EOS), a program consisting of three child survival initiatives: vitamin A supplementation, deworming, and screening and referral of malnourished children and malnourished pregnant and lactating women to the targeted supplementary feeding program (Carol Marshall, personal communication). The EOS began as a pilot project implemented in 52 woredas in 2004, and in January 2005, it was subsequently expanded to 325 drought-affected woredas. The present survey was conducted during the period in which the EOS was expanding coverage. Since September 2005, the EOS was expanded to the remaining 299 woredas, with the overall strategy that children aged 6–59 months receive vitamin A capsules twice per year.
The findings of the present study in Ethiopia provide a contrast with recent findings from a study of the coverage of the vitamin A supplementation program in Indonesia [16]. In Indonesia, 72% of preschool children, aged 12–59 months, had received a vitamin A capsule within the last 6 months. Children who were not reached by vitamin A supplementation had higher rates of stunting, underweight, wasting, and infectious disease morbidity, suggesting that the vitamin A program was not reaching children who could potentially benefit the most [16]. In contrast, in Ethiopia, there were no significant differences in stunting, underweight, or wasting, or diarrheal disease morbidity between children who did or did not receive a vitamin A capsule in the last 6 months. However, at the time of the survey, the national vitamin A supplementation program reached less than half the eligible children in Ethiopia. The findings from Ethiopia and Indonesia suggest that when program coverage is low, as in Ethiopia, the children who are reached by the vitamin A program are more or less random in the population, and fewer disparities are found between those who receive or do not receive a vitamin A capsule.
Both maternal and paternal education were identified as important factors that were associated with the child's receipt of a vitamin A capsule, with maternal education showing higher odds than paternal education. These findings are consistent with our previous studies of nearly one million households in Bangladesh and Indonesia in which the level of maternal education was a stronger predictor of better child care practices than paternal education (Richard Semba, submitted for publication). In rural Indonesia, low maternal education was associated with an increased risk that the child did not receive a vitamin A capsule [16].
Worldwide, more than 10 million children die each year, most deaths are from preventable causes, and nearly all deaths occur in poor countries [17]. Ethiopia, with an estimated 472 000 under-five child deaths per year, is ranked sixth in the total number of under-five child deaths among countries worldwide [17]. About 63% of child deaths could be prevented with full implementation of the few known and effective interventions to reduce child mortality, such as vitamin A supplementation [9]. Vitamin A deficiency also remains the leading single cause of blindness among children worldwide, and in Ethiopia, the high prevalence of Bitot's spots and night blindness shows that children are at a high risk of nutritional blindness [3].
In summary, this study suggests that high maternal and paternal education are important factors associated with receipt of a vitamin A capsule by the child. At the time of the survey, the national vitamin A supplementation program reached less than half of the children. The EOS has been expanded to reach all woredas in the country, and a future Demographic and Health Survey in Ethiopia should provide valuable information on the proportion of children covered within each woreda, now that the EOS has been expanded to nationwide coverage.
Acknowledgement
This study was supported by the Eye Foundation of America.

Comments