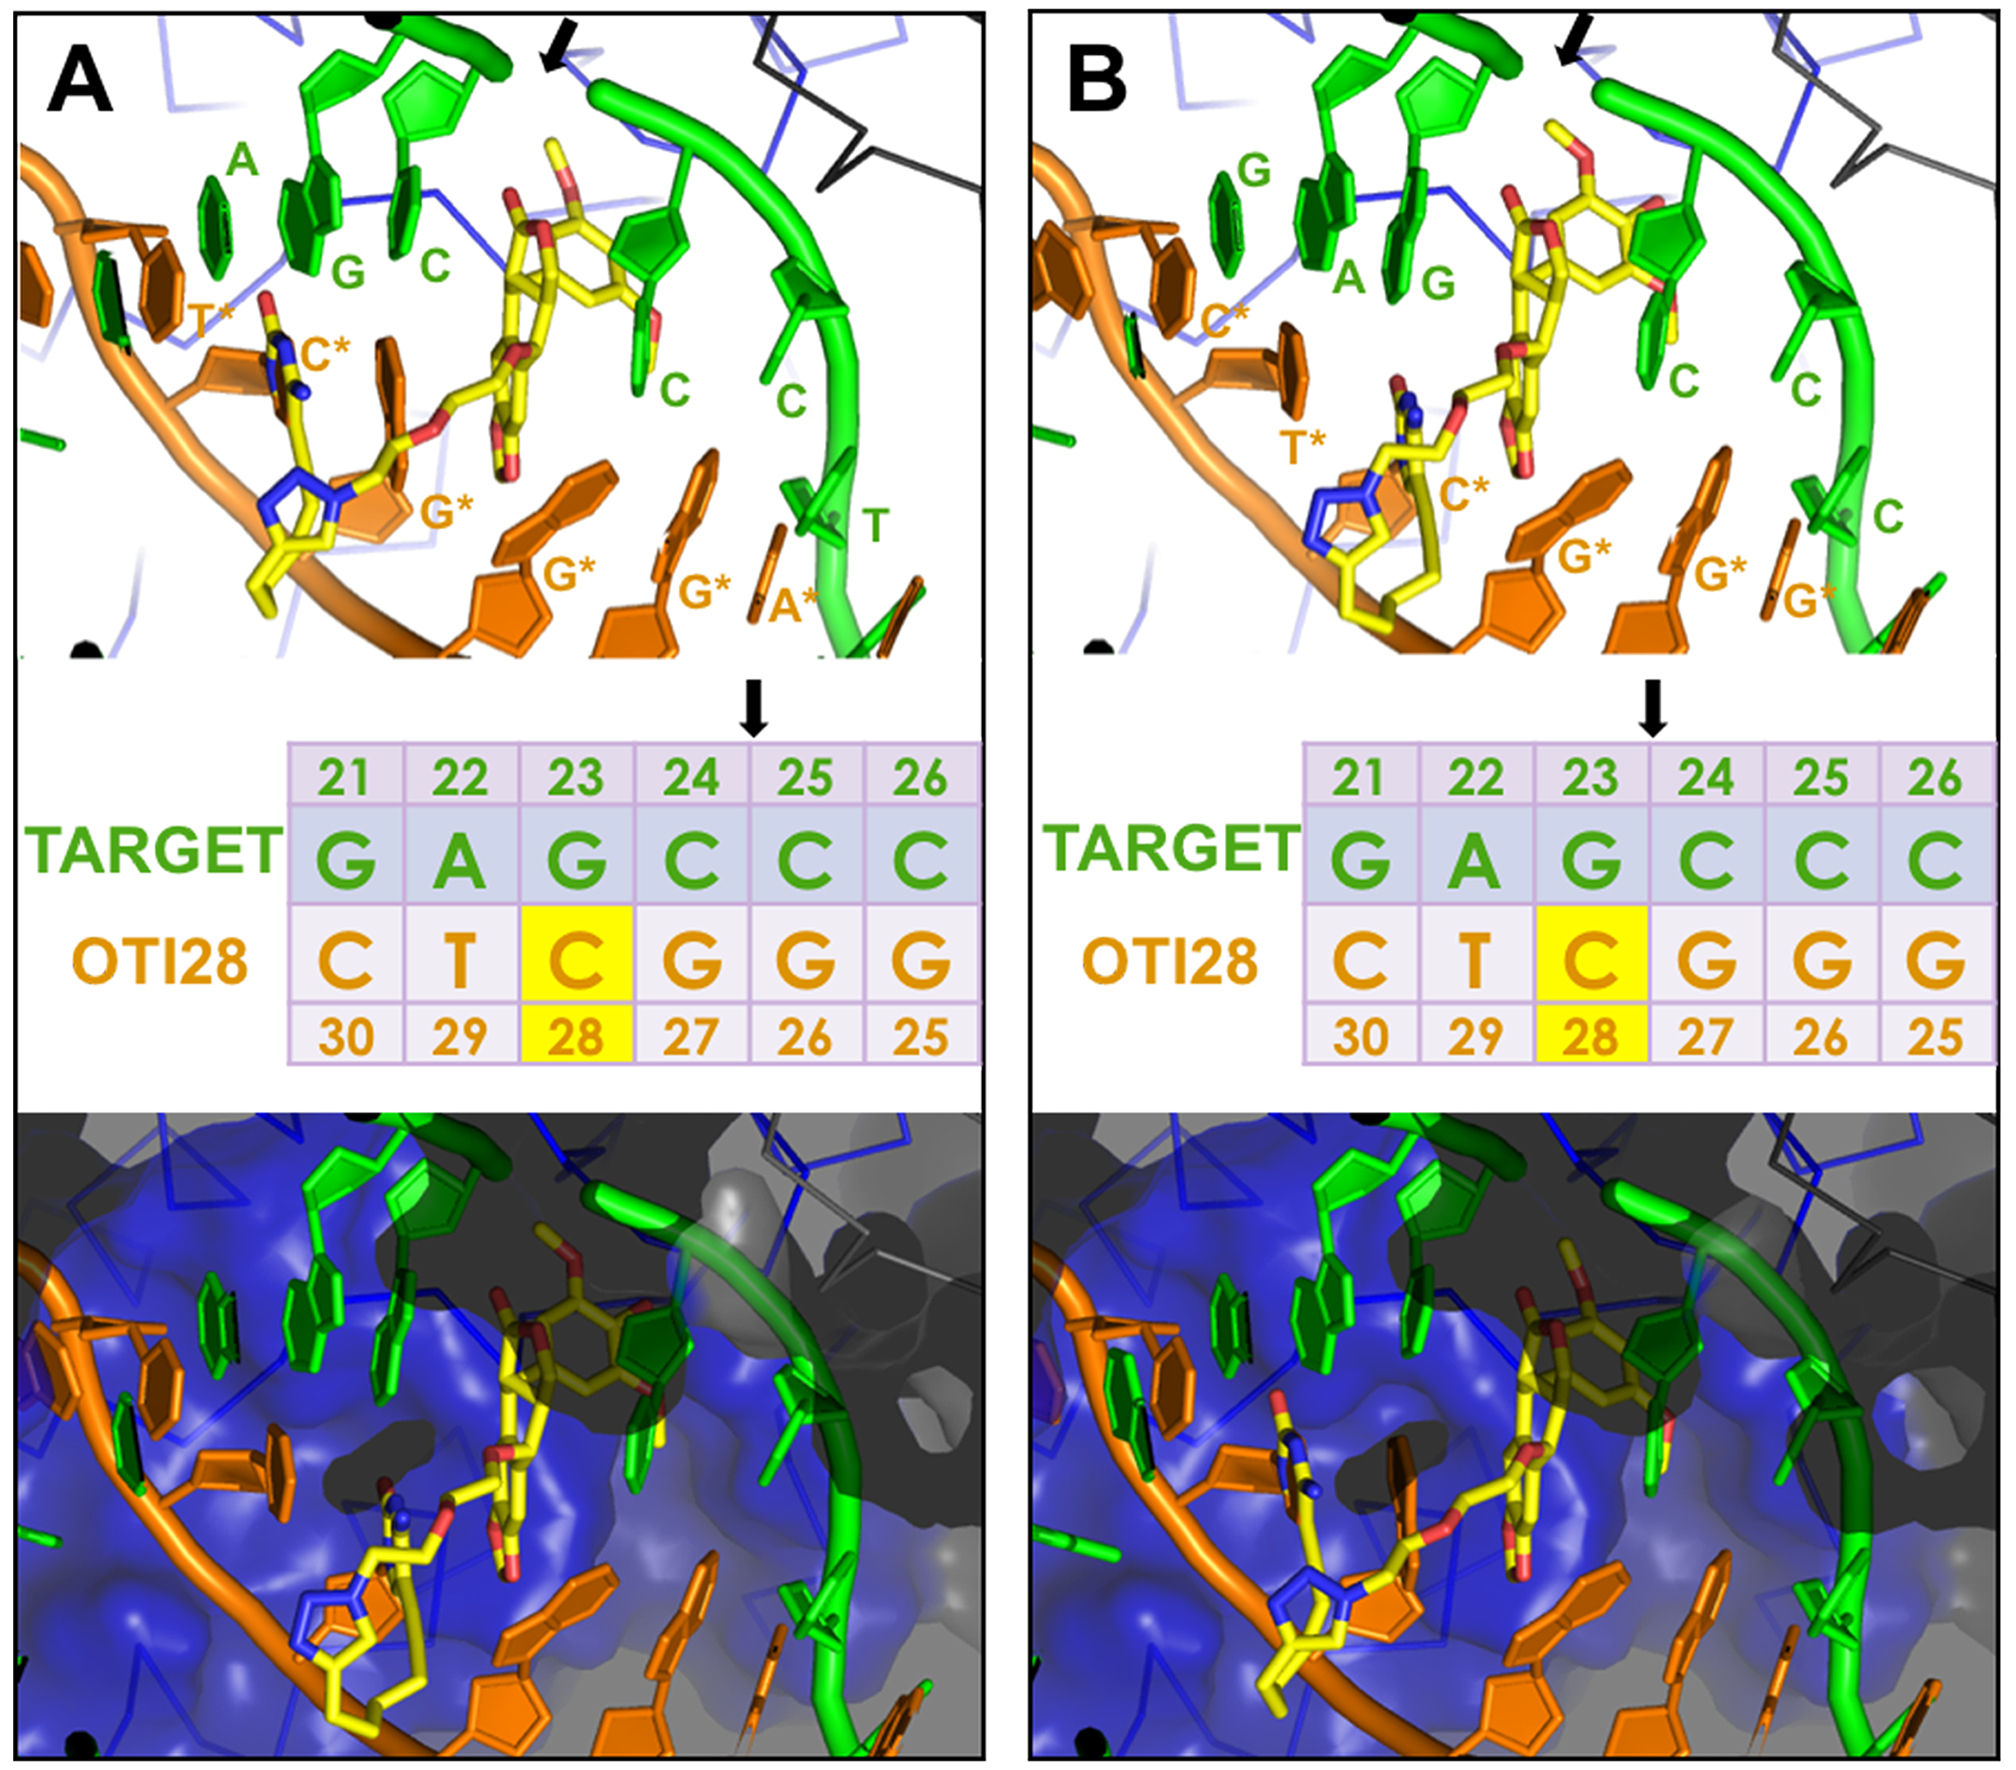
Molecular models of DNA cleavage complexes formed with OTI28. Models were based on the crystal structure of topoisomerase IIβ (34). (A) Cleavage between bases 24–25 is depicted on the target (top) strand (green). (B) Cleavage between bases 23–24 is depicted on the target strand (green). The bottom (OTI) strand is shown in orange. The tethered etoposide core is shown in yellow (carbons, yellow; nitrogen, blue; oxygen, red). A Cα trace is shown for the two topoisomerase II subunits (blue and black lines) in the top panels. The bottom panels include a semi-transparent molecular surface, illustrating that the linker does not clash with the protein. The sequence diagram (middle) shows the position of the tethered etoposide core on OTI28 (yellow box). Black arrows indicate the cleavage sites.