Figure 2:
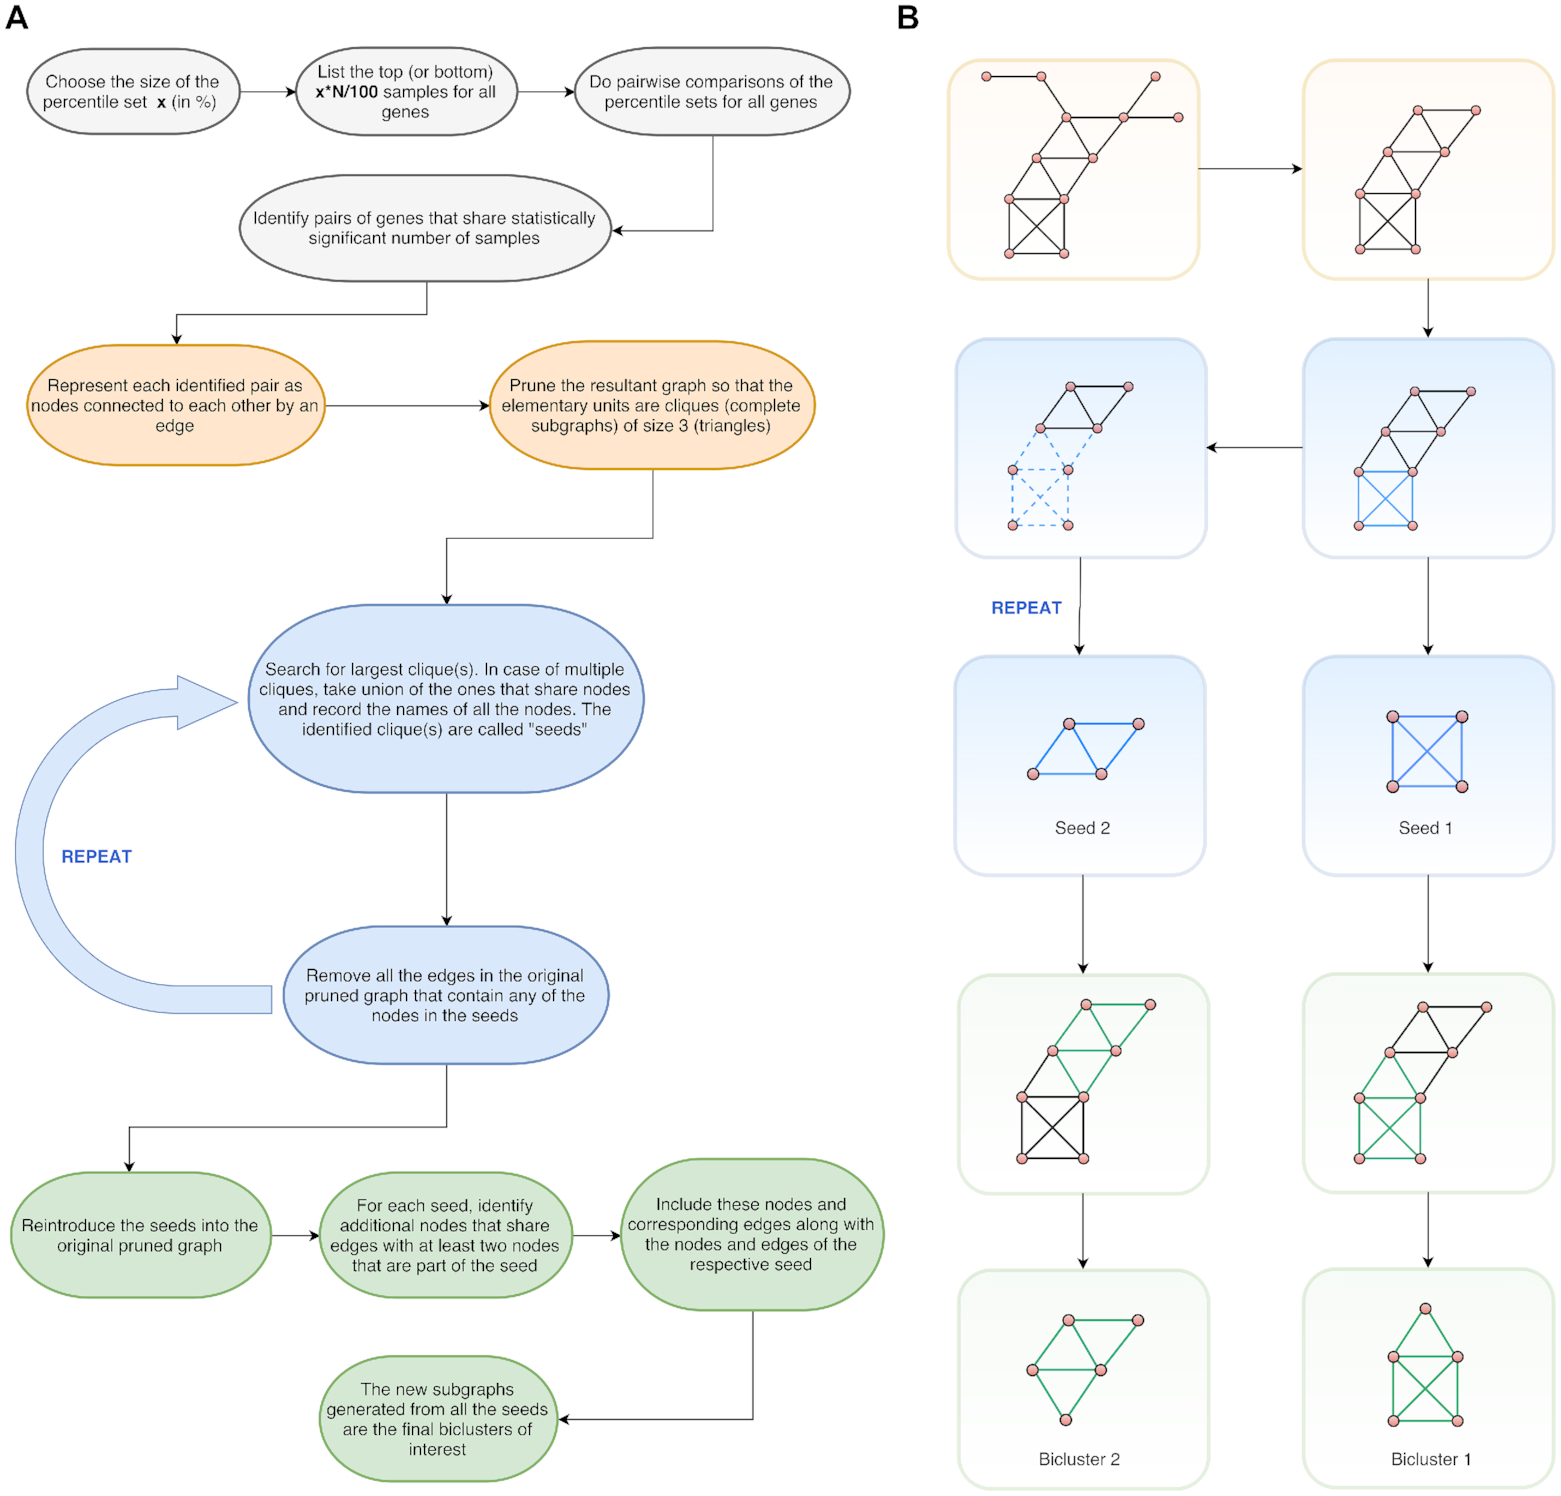
TuBA's schematics. (A) Flow chart of the pipeline for TuBA. (B) Schematic representation of the graph-based approach to discover biclusters.
TuBA's schematics. (A) Flow chart of the pipeline for TuBA. (B) Schematic representation of the graph-based approach to discover biclusters.