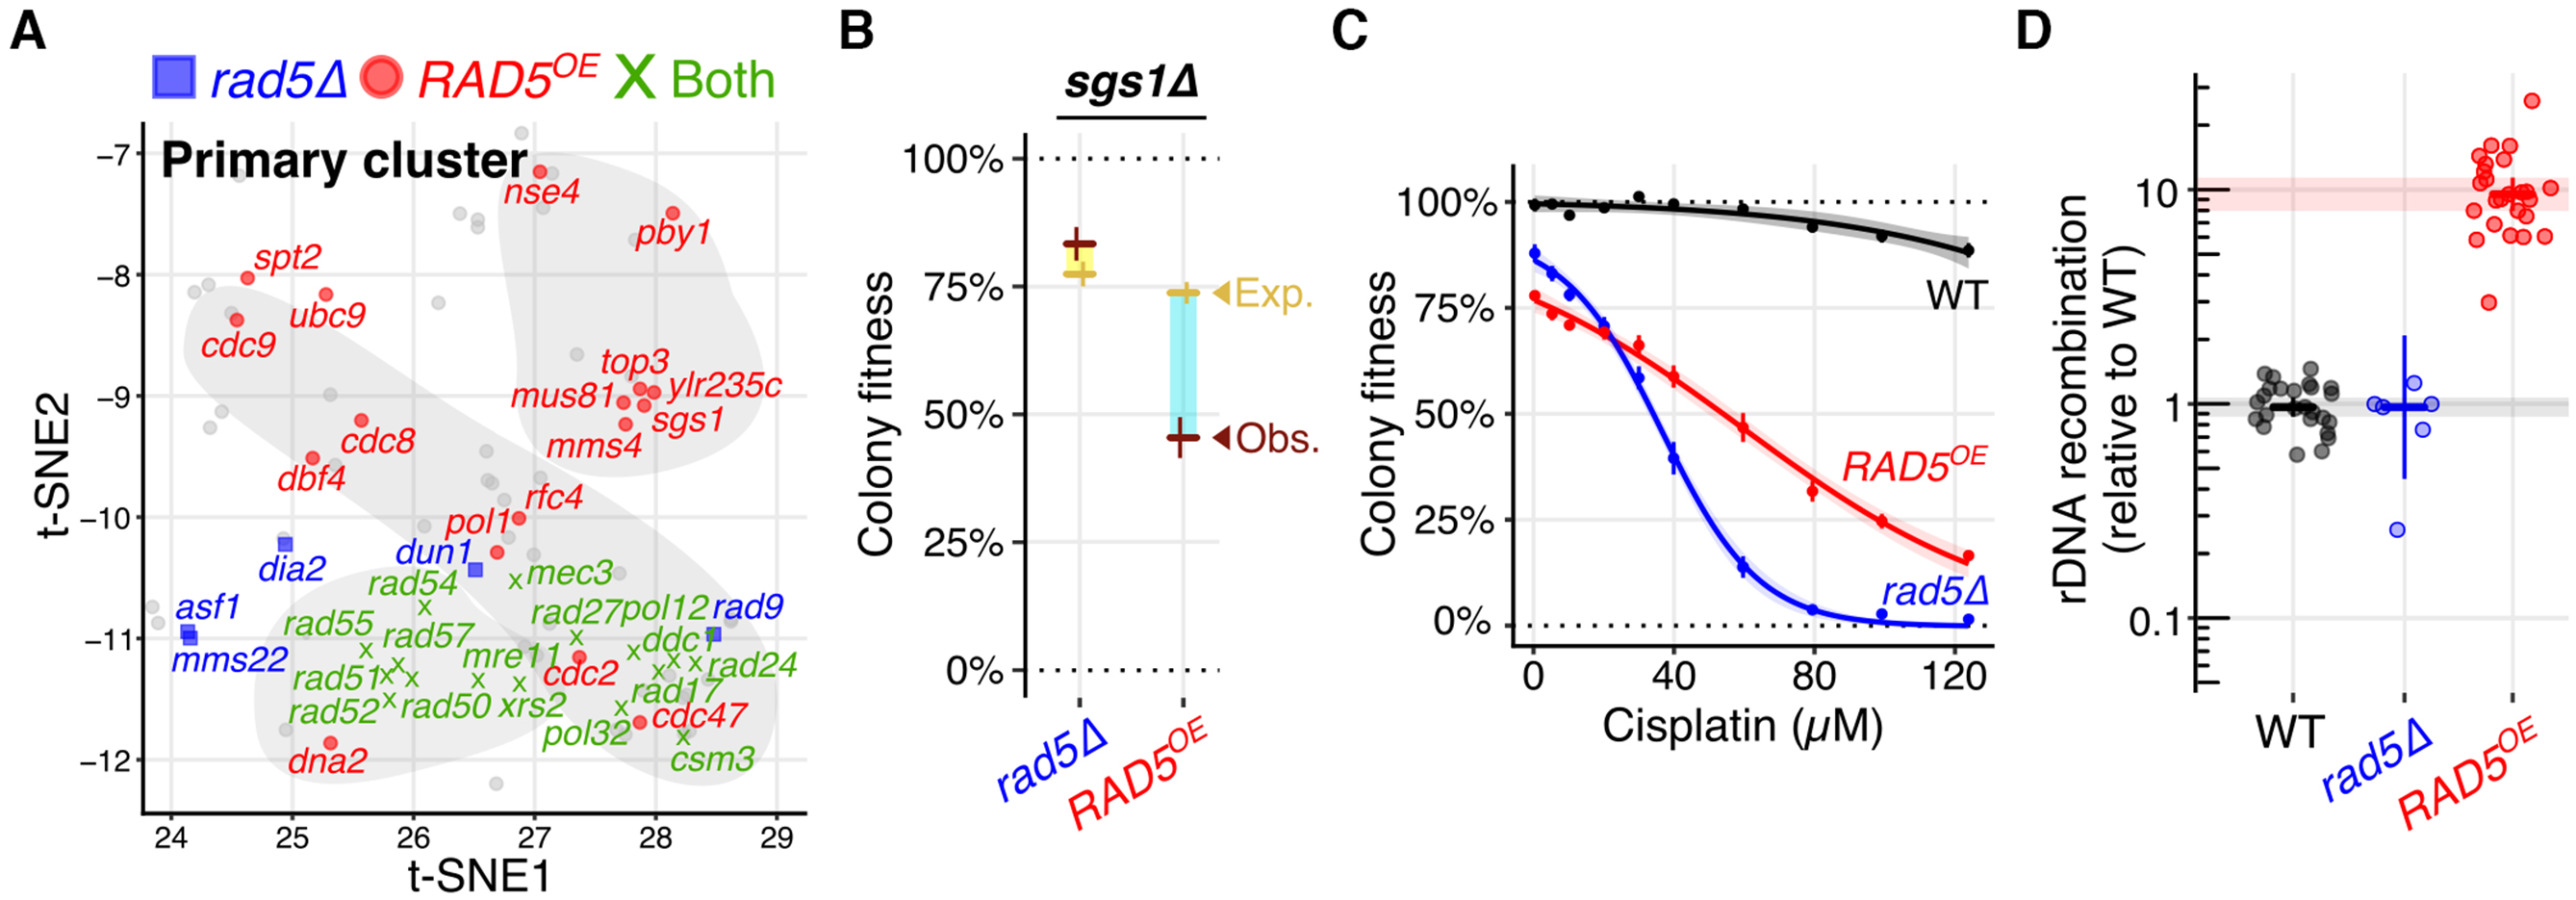
RAD5OE causes a specific requirement for crossover resolution, sensitivity to replication inhibitors and increased recombination. (A) Panel shows the primary cluster from Figure 1C highlighting genetic interactions specific to RAD5OE (red circles), rad5Δ (blue squares) or shared between RAD5OE and rad5Δ (green Xs). Interaction data for rad5Δ was acquired from BioGRID (59). (B) Quantified colony fitness confirms the absence of an sgs1Δ rad5Δ genetic interaction, and presence of an sgs1Δ RAD5OE interaction. Horizontal and vertical bars represent the mean and 95% CI of at least four independent experiments for observed (red) and expected (yellow) fitness. Turquoise and yellow rectangles represent negative and positive interaction magnitudes respectively. (C) Both RAD5OE and rad5Δ cause cisplatin sensitivity. Cisplatin dosage response curves for WT, RAD5OE, and rad5Δ are shown. Colony fitness was scored relative to untreated WT. Points and vertical bars represent the mean and 95% CI of four independent experiments. Shaded regions represent the 95% confidence band of the modeled dose response curves. (D) RAD5OE, but not rad5Δ, promotes tandem repeat recombination in ribosomal DNA (rDNA). rDNA recombination frequency was measured by loss of ADE2 and CAN1 markers incorporated within the rDNA tandem repeat array. Frequencies are normalized to the median recombination frequency observed for a WT assay strain with an empty vector. Horizontal and vertical bars indicate the median and 95% CI for at least 6 independent experiments shown as points.