Fig. 4.
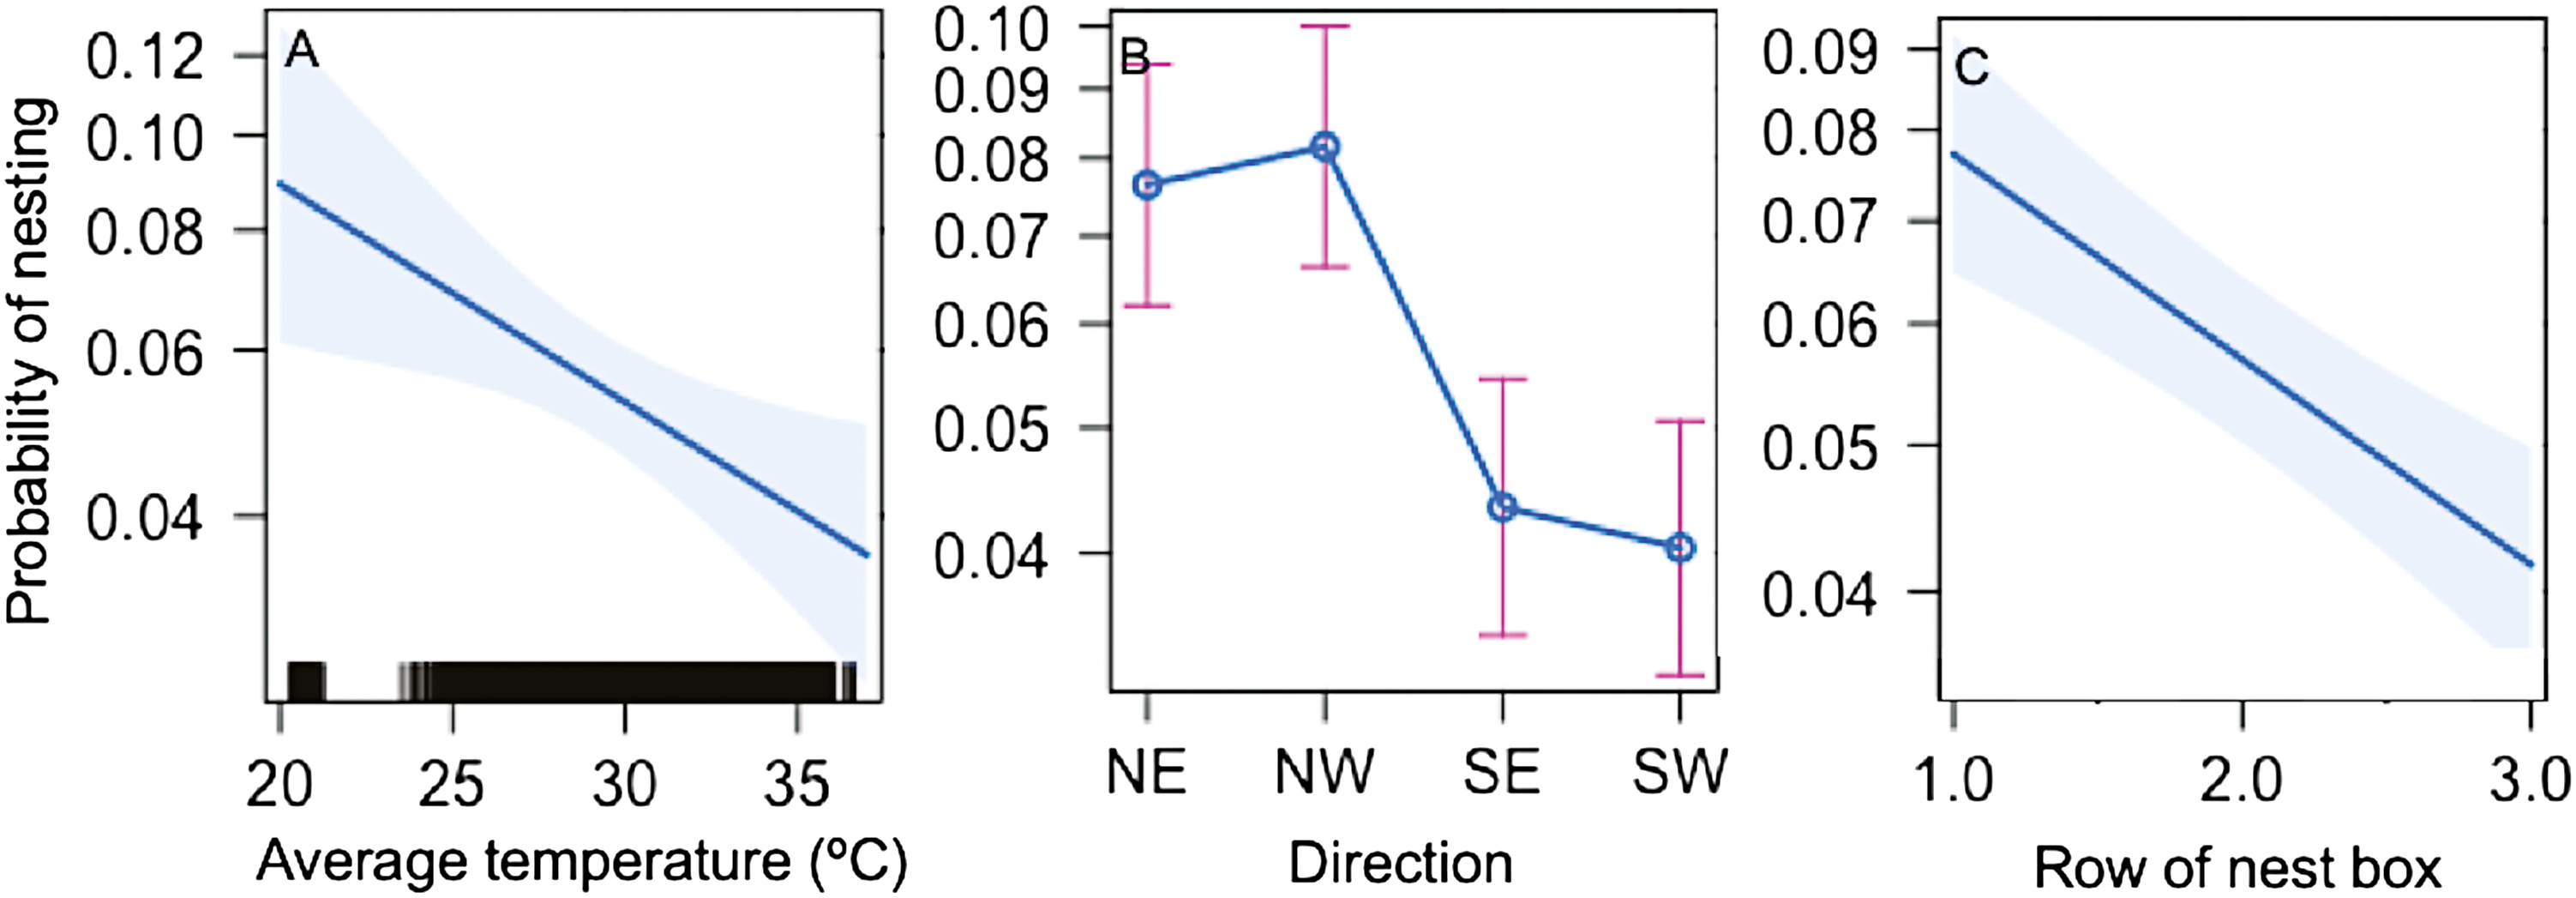
The probability of nesting in a cavity decreases as the average temperature of the cavity increases. (A) Cavity temperature significantly predicted nesting (P = 0.0049). (B) Direction the cavity faced significantly influenced the probability of nesting (P = 0.0003), as did the row of the nest box (C, P < 0.0001). Lines represent fitted values from the multivariate model. Shading on (A) and (C) is a confidence band based on standard errors, as are the whiskers in (B). Black bars on the x-axis of (A) show the range of values in the data set.