Figure 4.
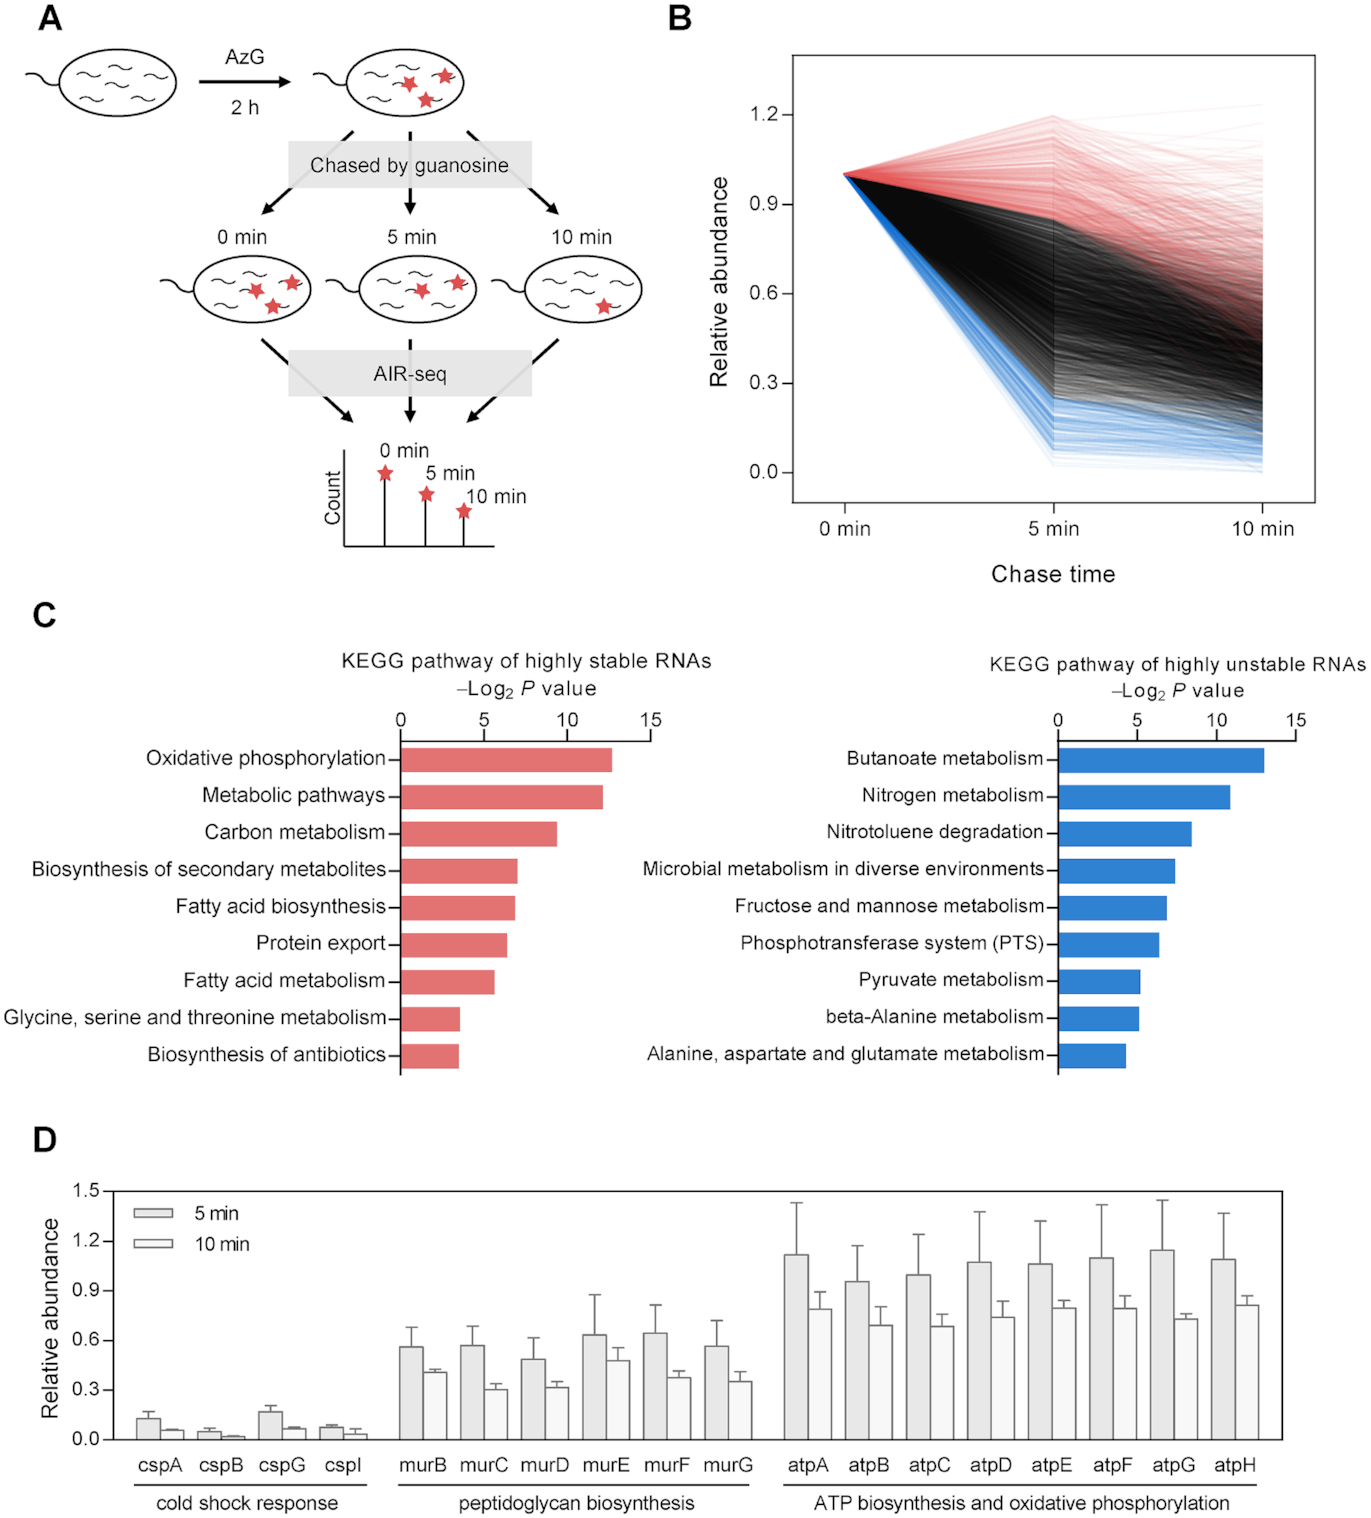
AIR-seq for profiling RNA degradation. (A) Workflow of pulse-chase labeling with AzG, followed by AIR-seq, for genome-wide measurement of RNA degradation. (B) Distribution of genome-wide decay profiles showing the relative abundance of 3052 transcripts across the time course of the chase phase. Each line represents the decay profile of a specific transcript. Highly stable and unstable genes were plotted in red and blue, respectively. (C) GO analysis of highly stable genes (left) and highly unstable genes (right) showing top enriched terms of KEGG pathway. (D) Representative decay profiles of families of genes involved in cold shock response, peptidoglycan biosynthesis, and ATP biosynthesis and oxidative phosphorylation.