Figure 6.
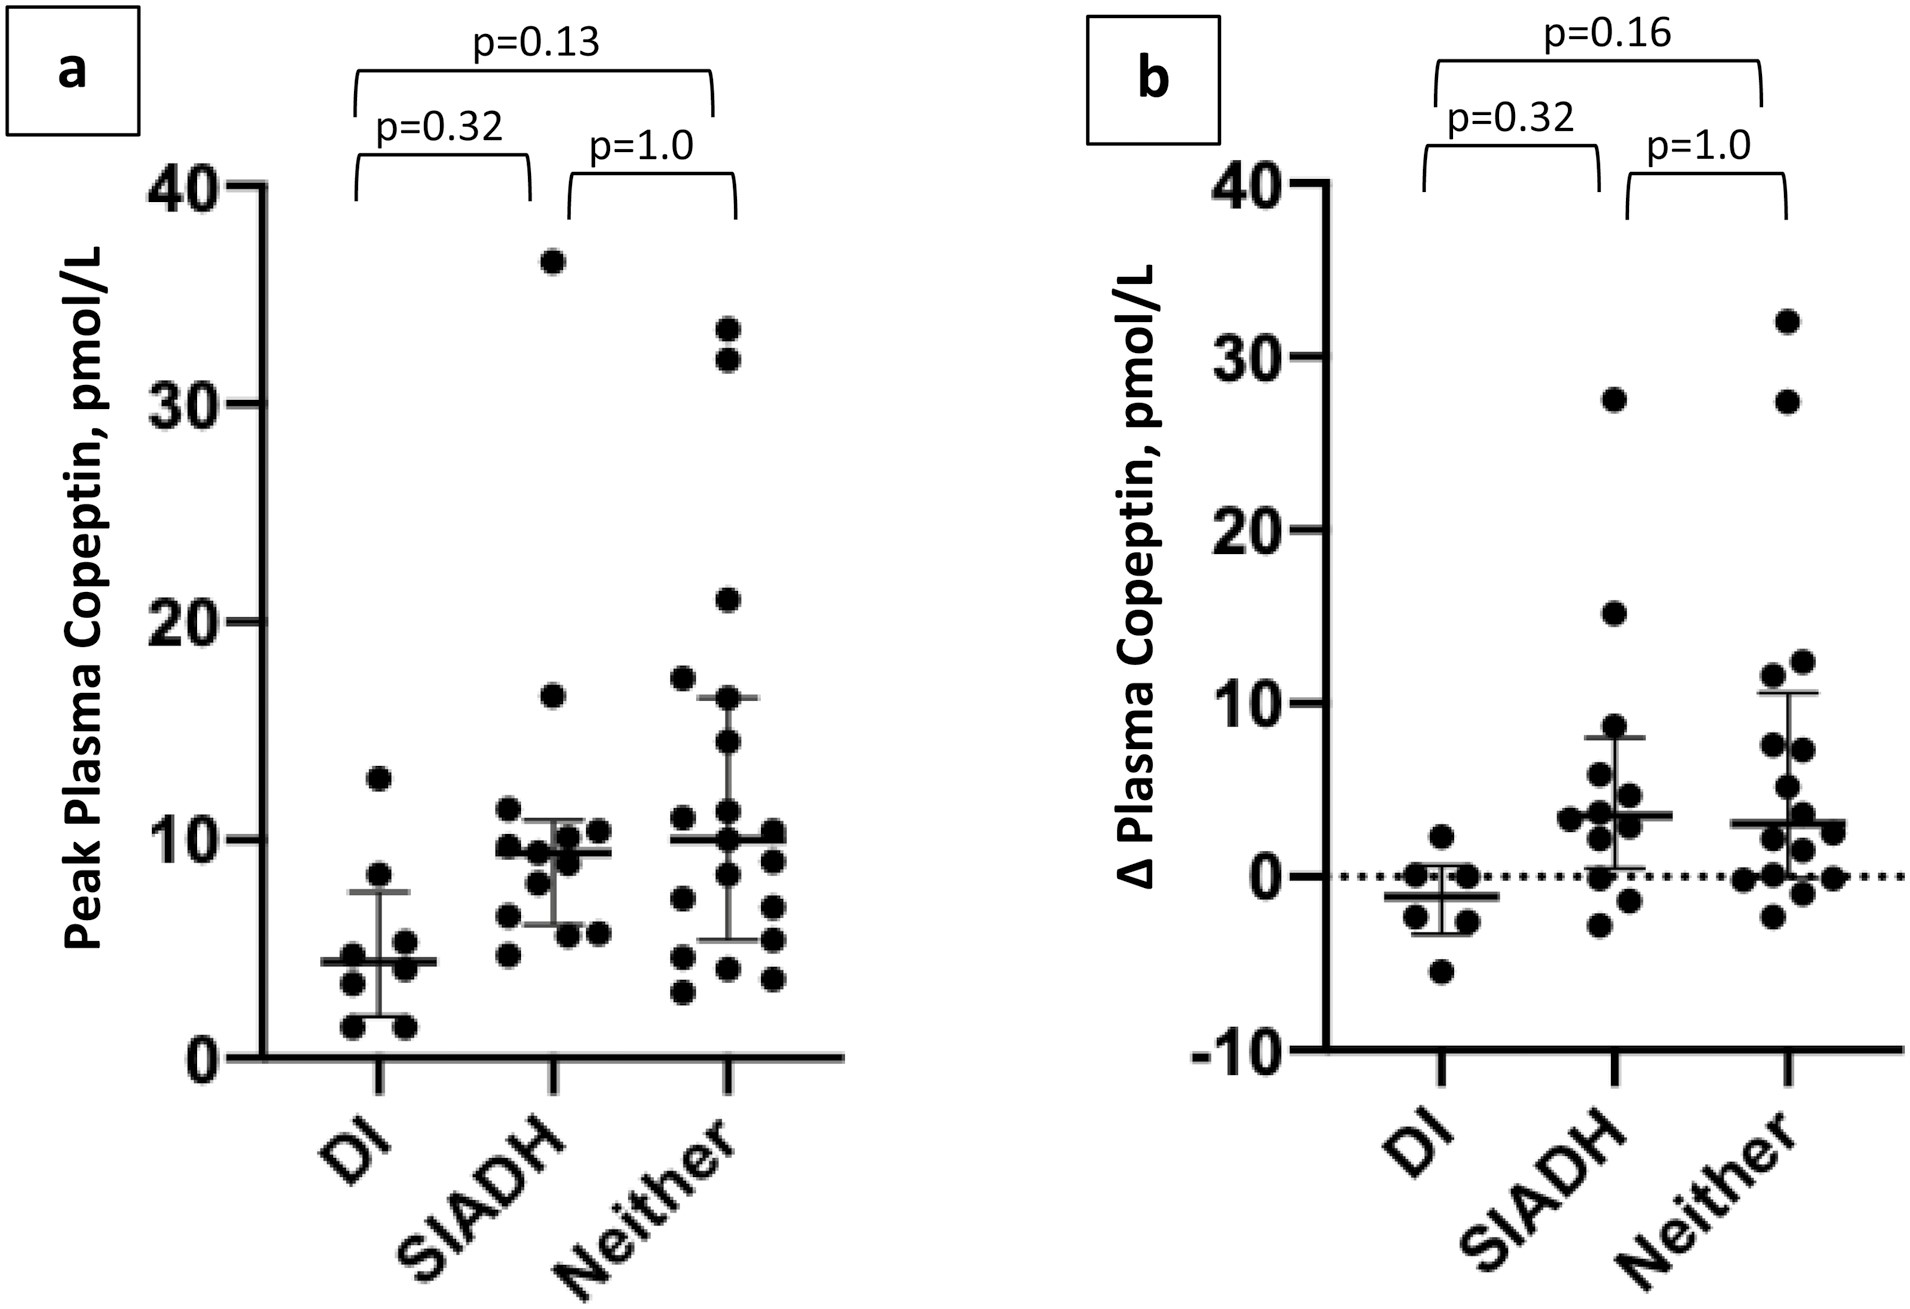
(A) Peak postoperative plasma copeptin, comparing those who developed DI, SIADH, or neither (P = 0.029 for comparison of all 3 groups). (B) ∆ Copeptin (preoperative plasma copeptin subtracted from postoperative peak plasma copeptin), comparing those who developed DI, SIADH, or neither (P = 0.043 for comparison of all 3 groups). Horizontal lines = median. Whiskers = 25th and 75th interquartile ranges. Top brackets = pairwise comparisons. P values presented are after Bonferroni correction for multiple comparisons.