Figure 7.
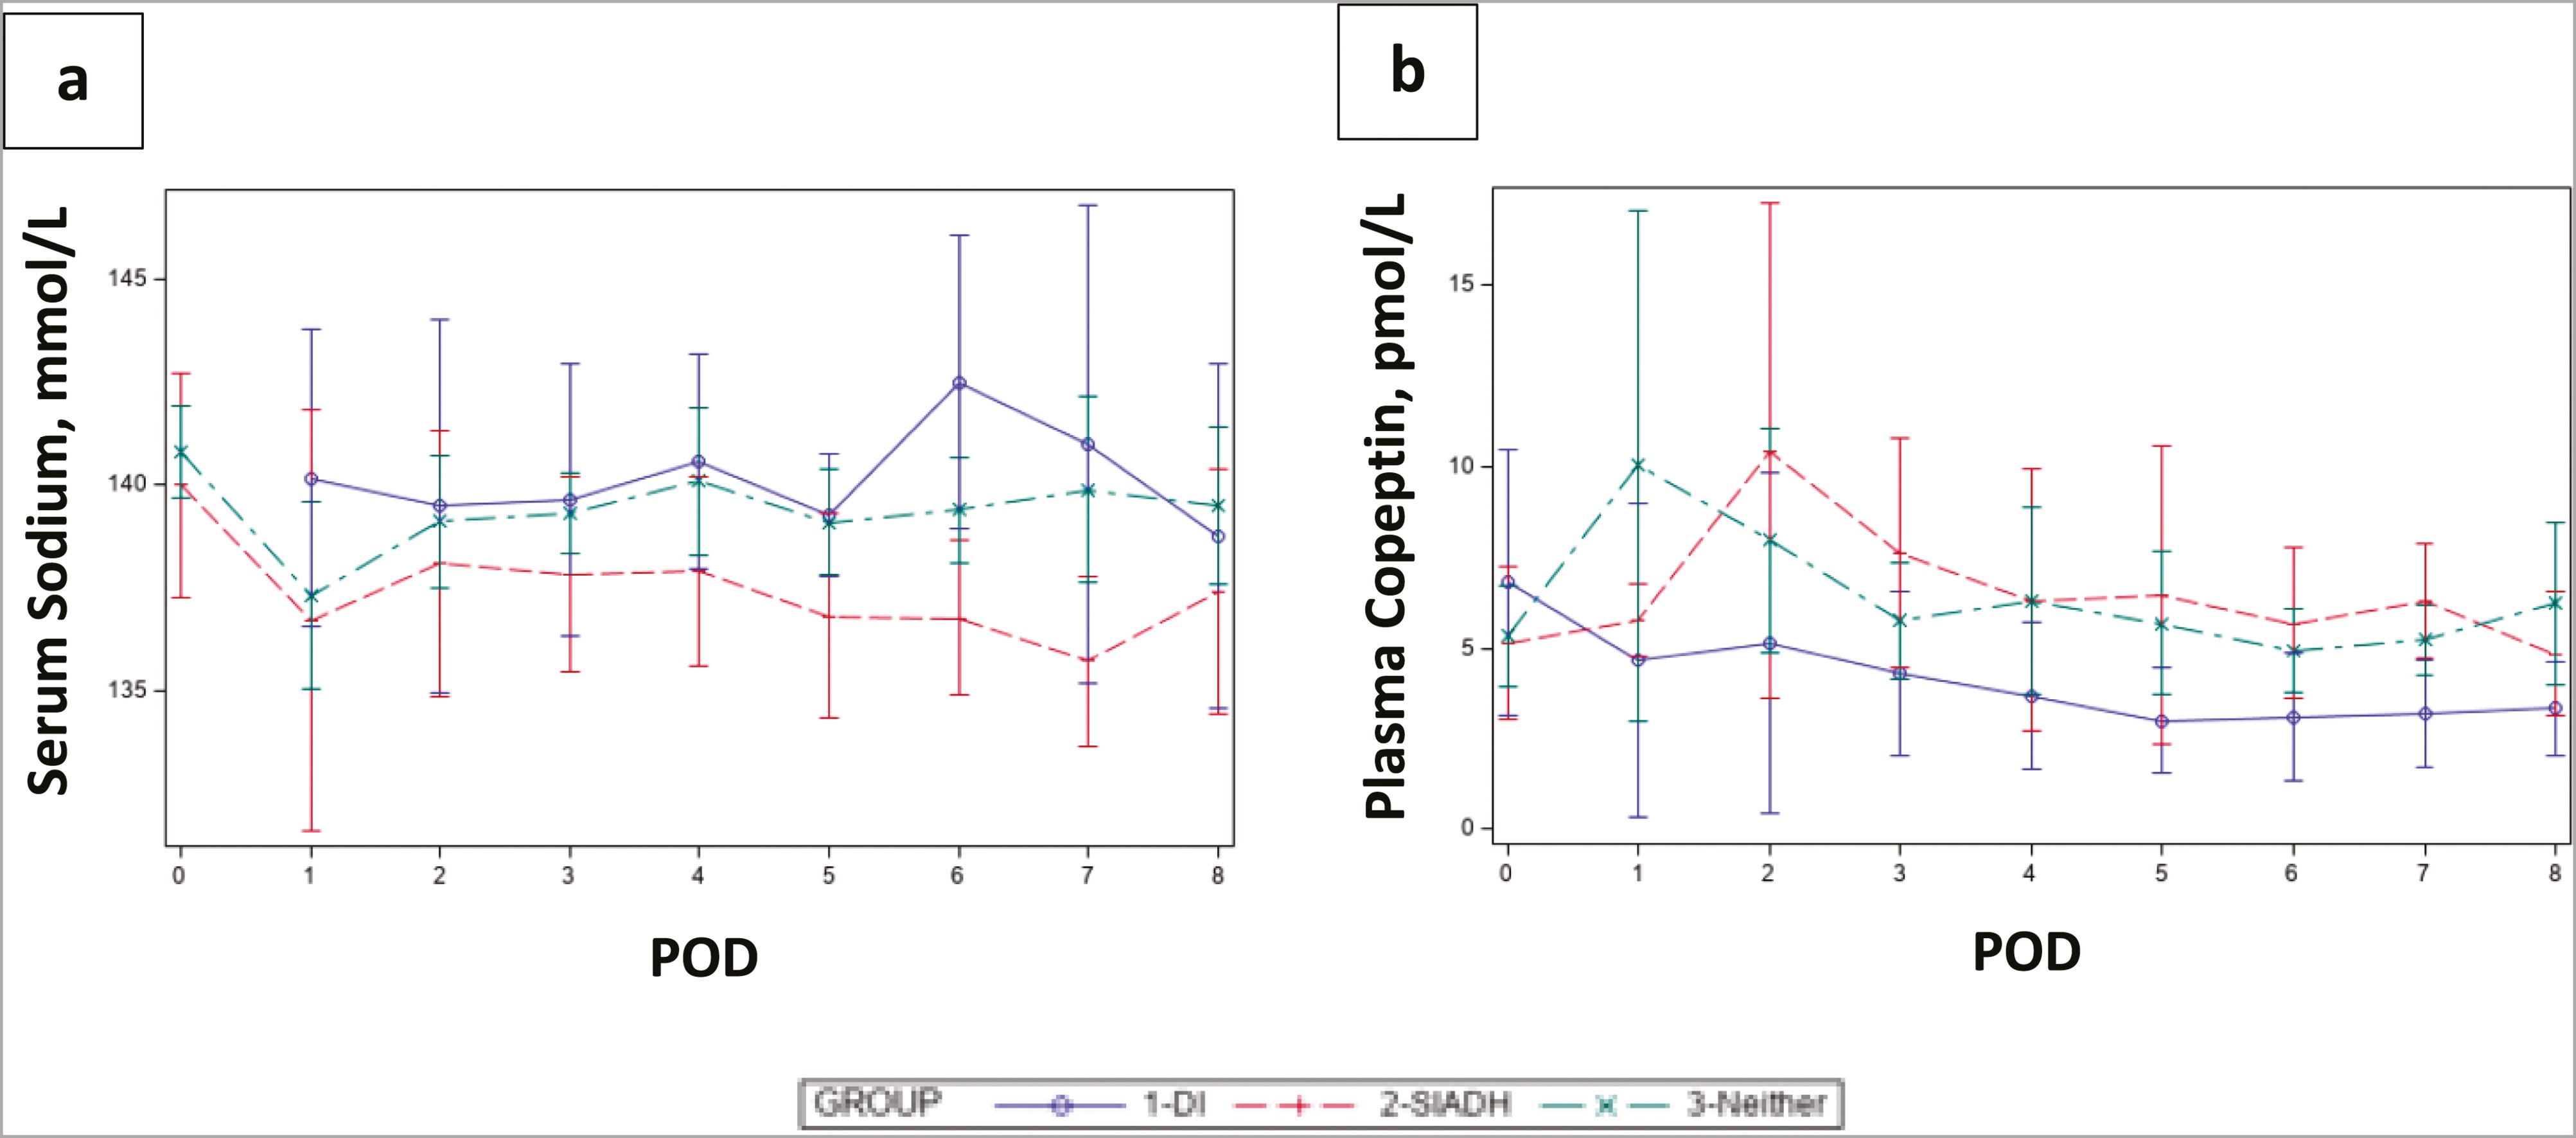
(A) Serum sodium and (B) plasma copeptin by POD and water balance status longitudinal data, adjusting for subgroups (ie, DI, SIADH, neither). Data points at point 0 on the x-axis indicate preoperative values. As expected, there was a group difference (P = 0.003) in serum sodium over time (all with DI were missing preoperative serum sodium), with the difference being driven by DI vs SIADH (P = 0.007), and SIADH vs neither (P = 0.012). There was no group difference in plasma copeptin over POD by water balance status (P = 0.16) over time.