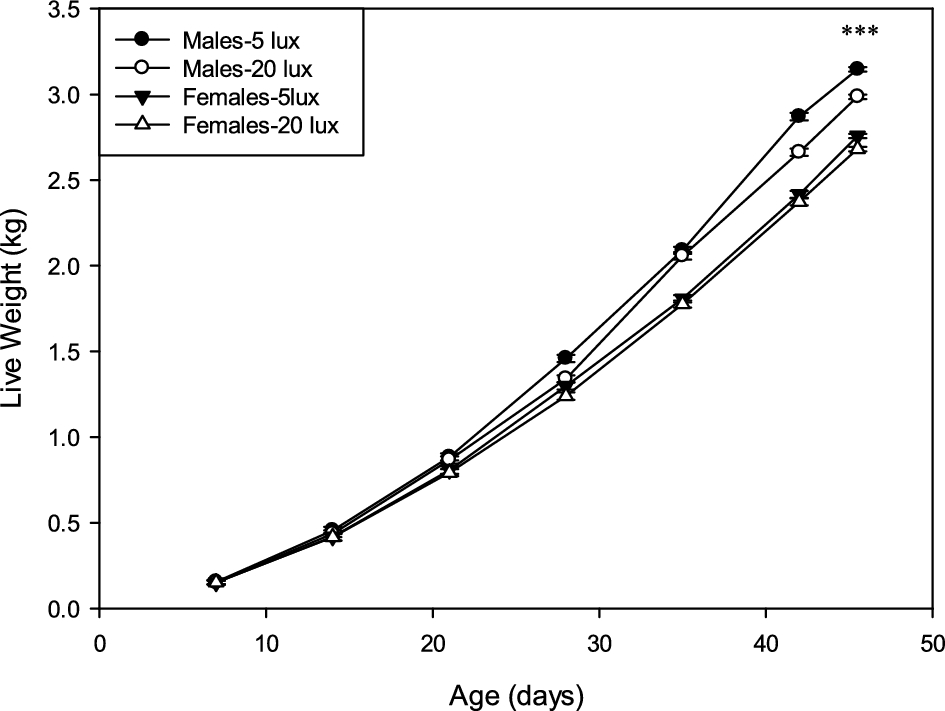
Live weight for each week according to light intensity and sex (LS-means ± SEM; ***P < 0.001).
Sign In or Create an Account
This PDF is available to Subscribers Only
For full access to this pdf, sign in to an existing account, or purchase an annual subscription.