Figure 14
Present-day uplift rate predictions for the IJ05, ICE-5G, W12 and W12a GIA models. W12 and W12a predictions are calculated using the optimum earth model (see main text). Elastic-corrected GPS rates (Thomas et al. 2011) are plotted using the same colour scale, and the magnitude of the circle at each GPS site is inversely proportional to the GPS uncertainty at that site.
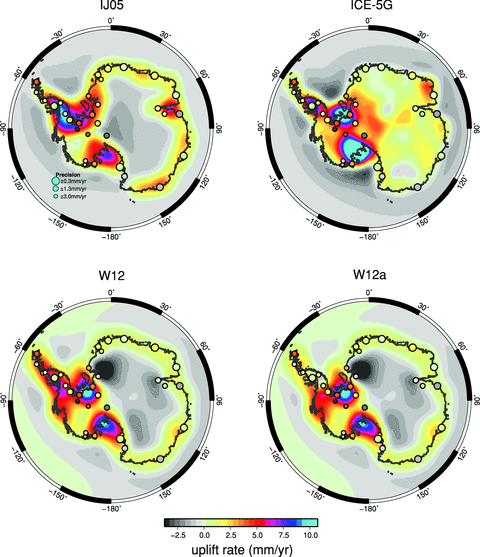
Present-day uplift rate predictions for the IJ05, ICE-5G, W12 and W12a GIA models. W12 and W12a predictions are calculated using the optimum earth model (see main text). Elastic-corrected GPS rates (Thomas et al. 2011) are plotted using the same colour scale, and the magnitude of the circle at each GPS site is inversely proportional to the GPS uncertainty at that site.

Close
This Feature Is Available To Subscribers Only

Sign In or Create an Account

Close

This PDF is available to Subscribers Only

View Article Abstract & Purchase Options

For full access to this pdf, sign in to an existing account, or purchase an annual subscription.

Close