Figure 1.
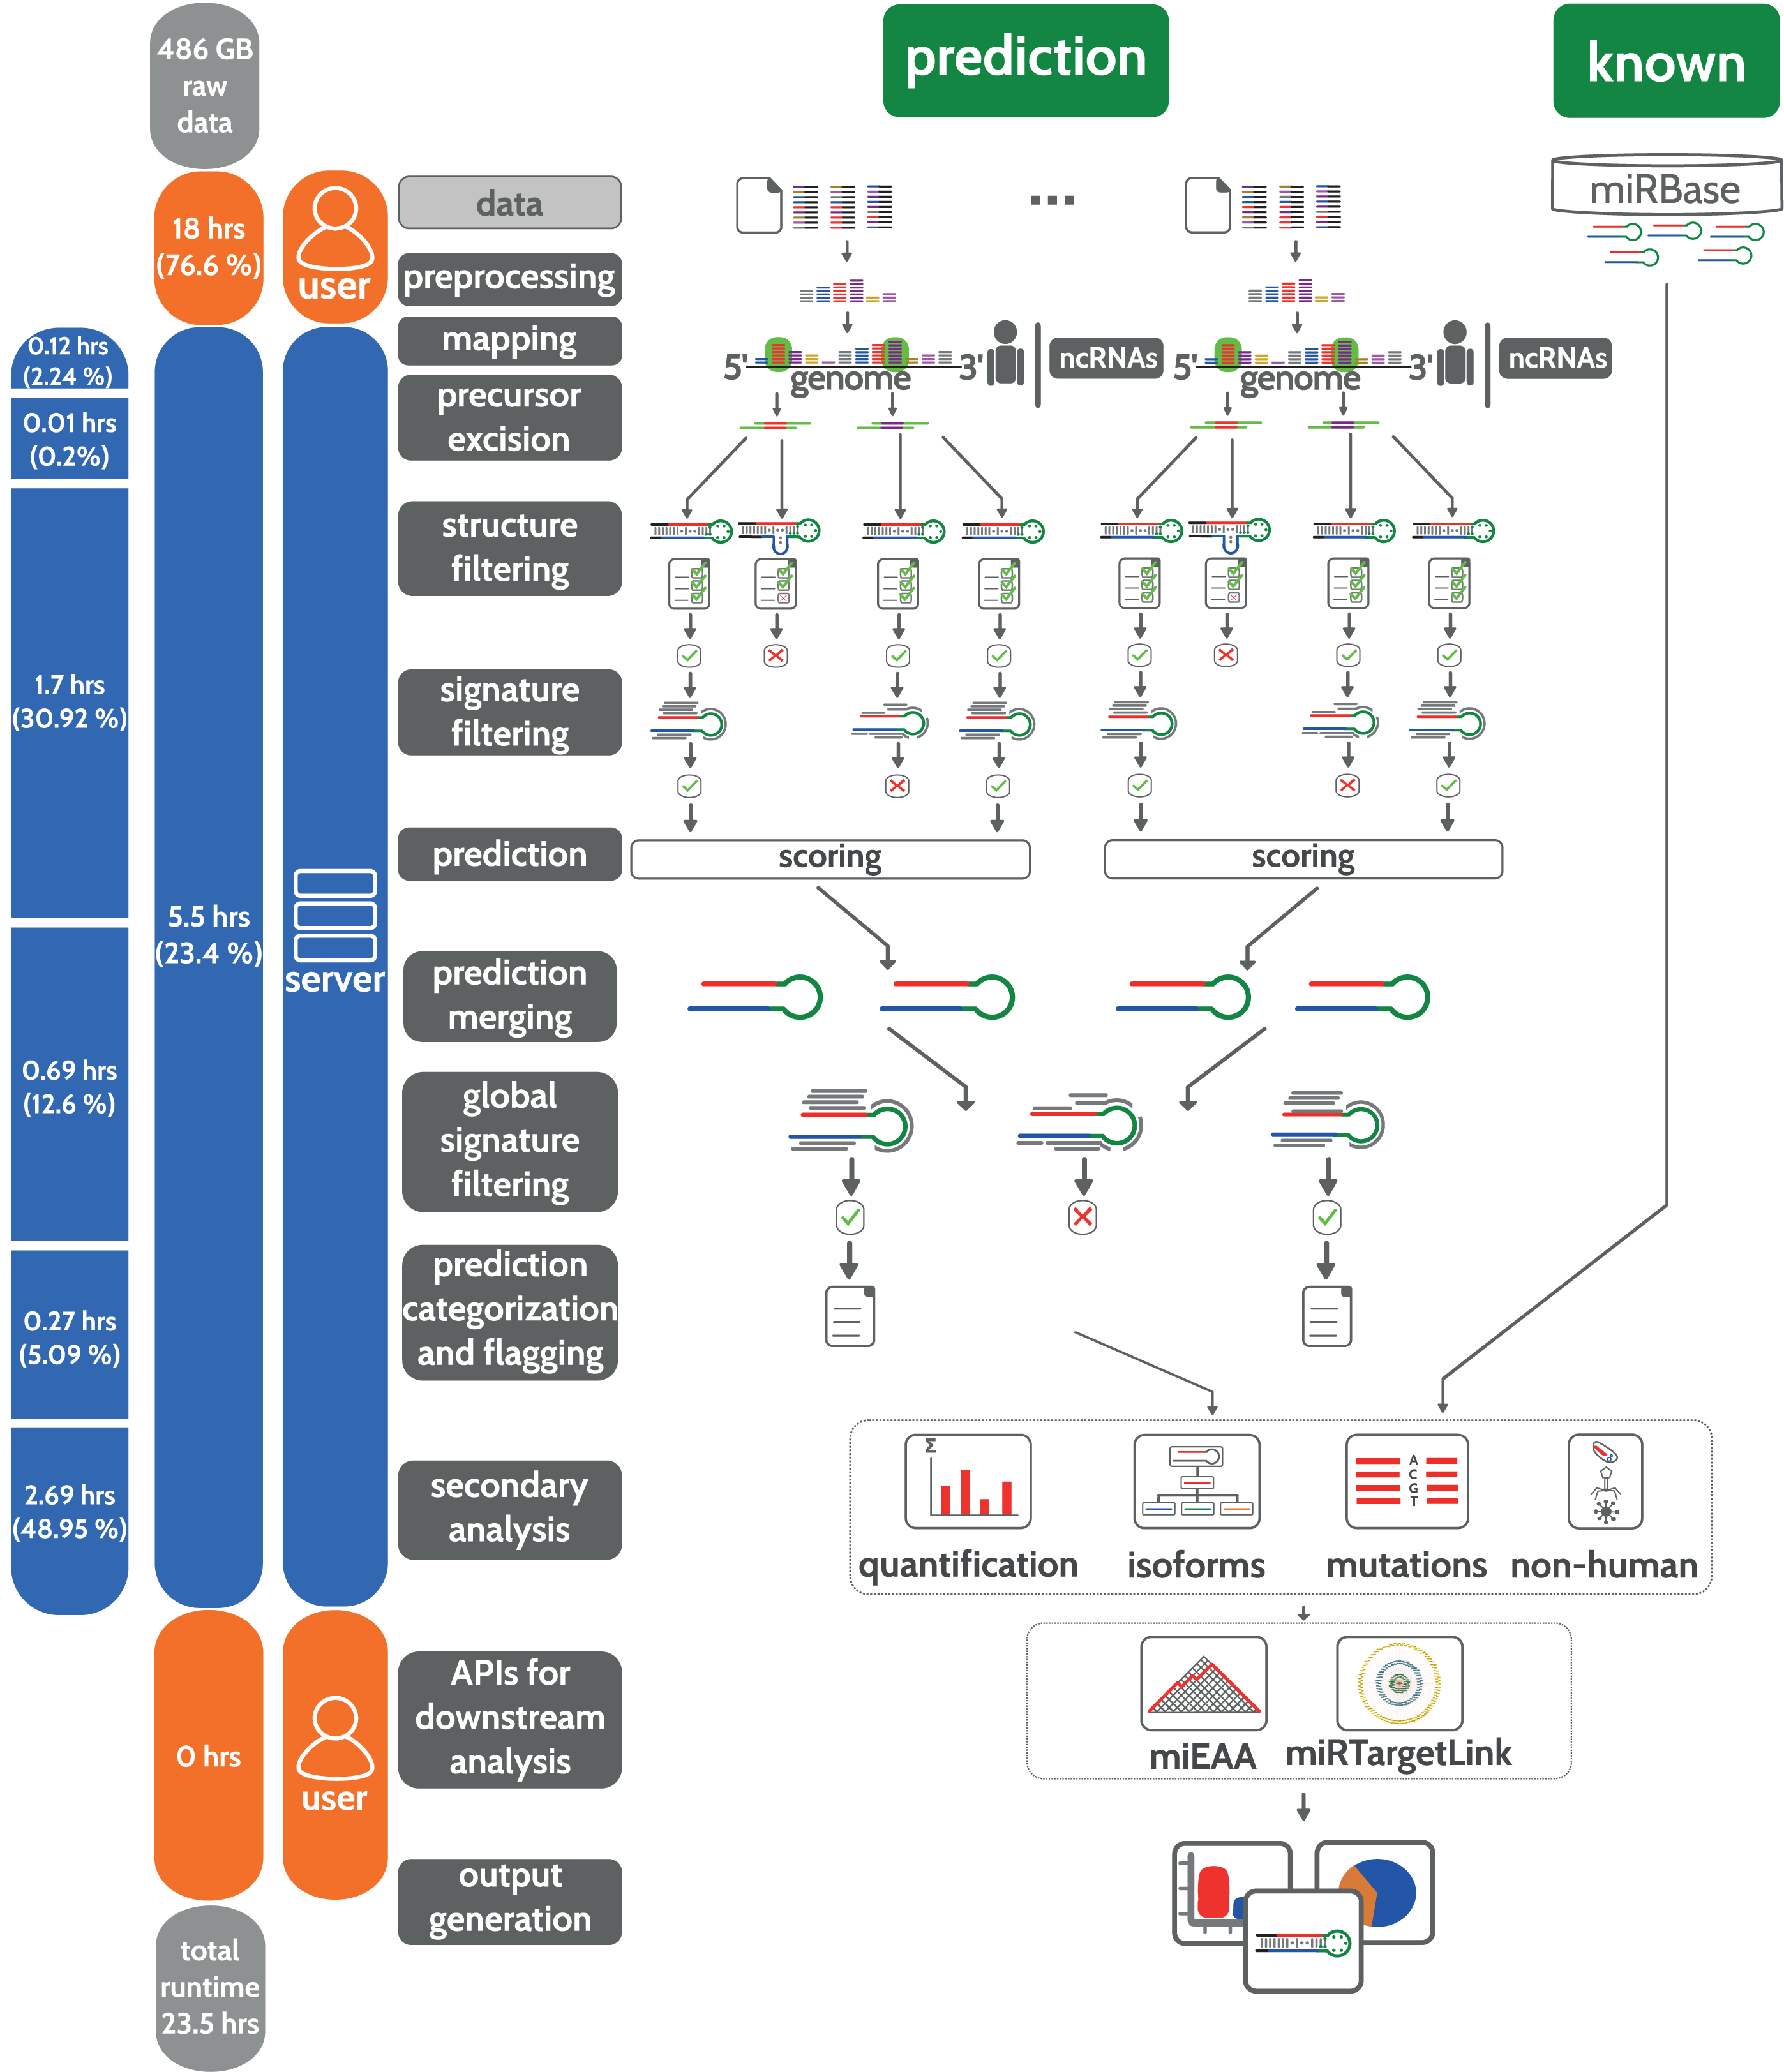
Schematic workflow of miRMaster. The bar at the left shows the runtime impact of each step. Steps performed by the user are shown in orange and steps performed by the server in blue.
Schematic workflow of miRMaster. The bar at the left shows the runtime impact of each step. Steps performed by the user are shown in orange and steps performed by the server in blue.